

Algiers
Country:
Algeria
Year:
2021
Average NO2:
3.098e+15
Uncertainty (±%):
8.47
Image
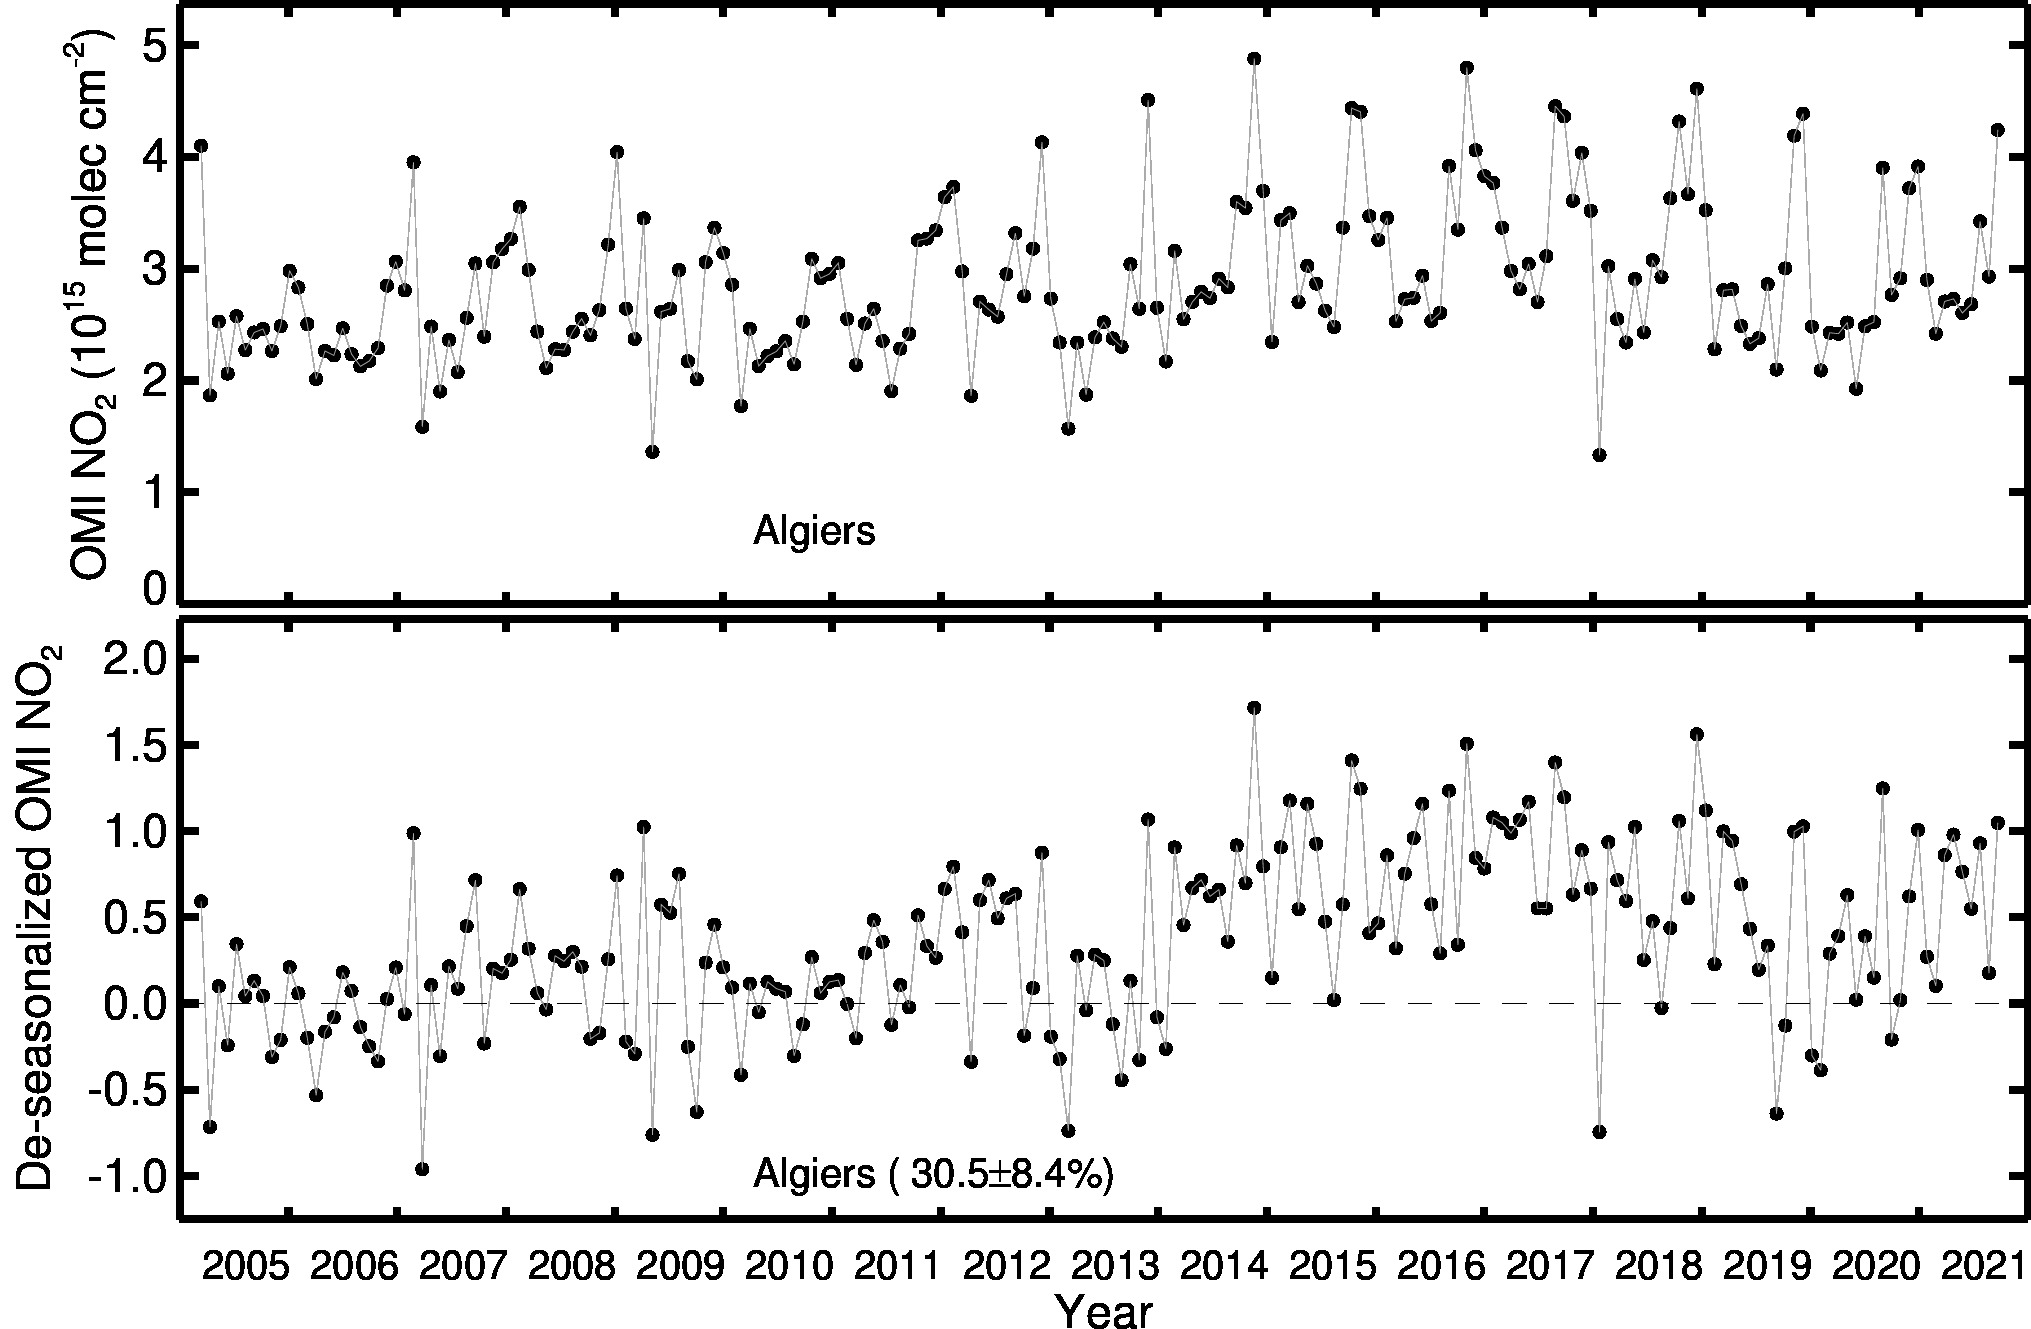
Algiers Line Plot 2005-2021
Algiers OMI data between 2005-2021.
Image
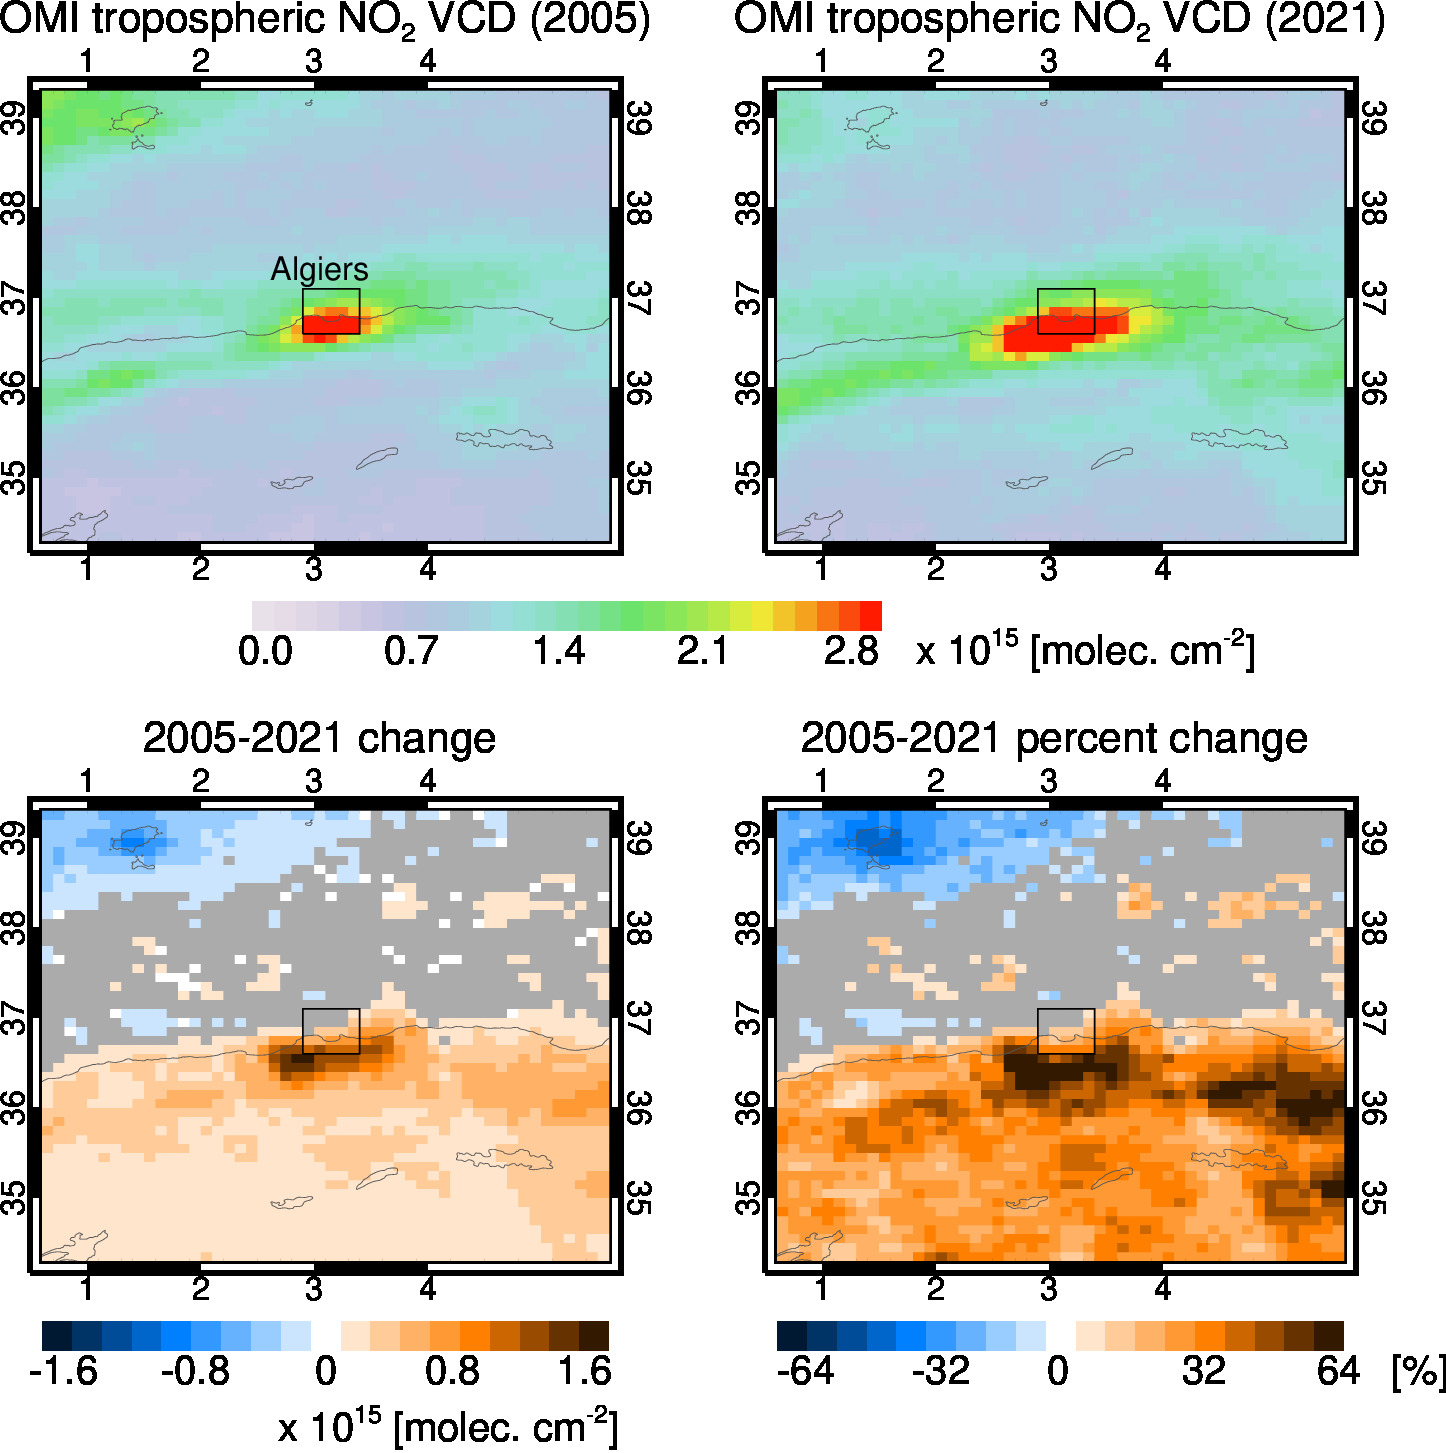
Algiers City Trend 2005-2021
Algiers OMI data between 2005-2021.