

Johannesburg
Country:
South Africa
Year:
2021
Average NO2:
5.721e+15
Uncertainty (±%):
11.87
Image
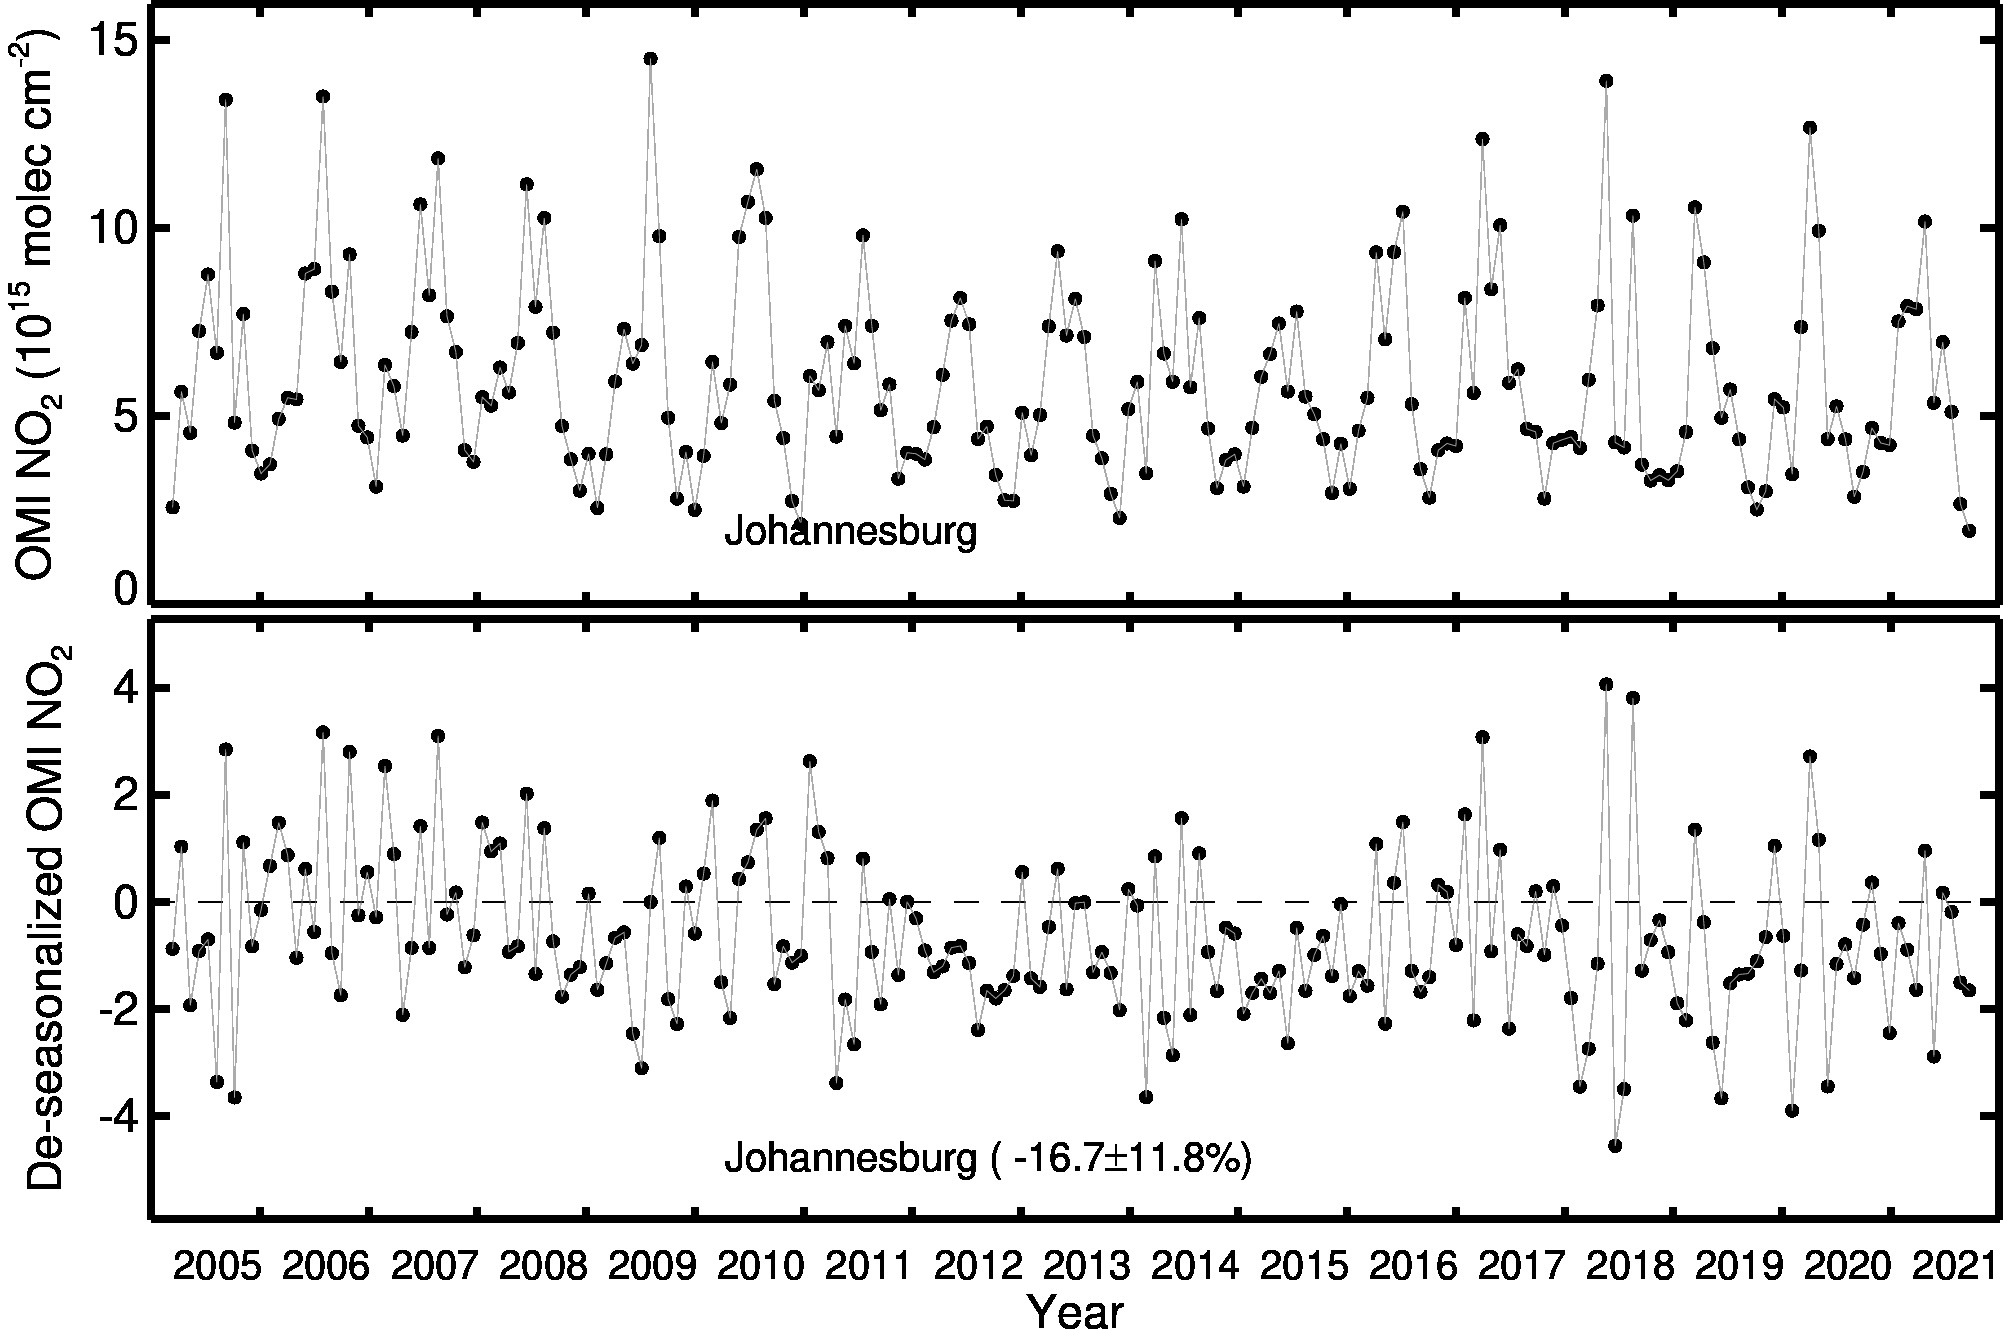
Johannesburg Line Plot 2005-2021
Johannesburg OMI data between 2005-2021.
Image
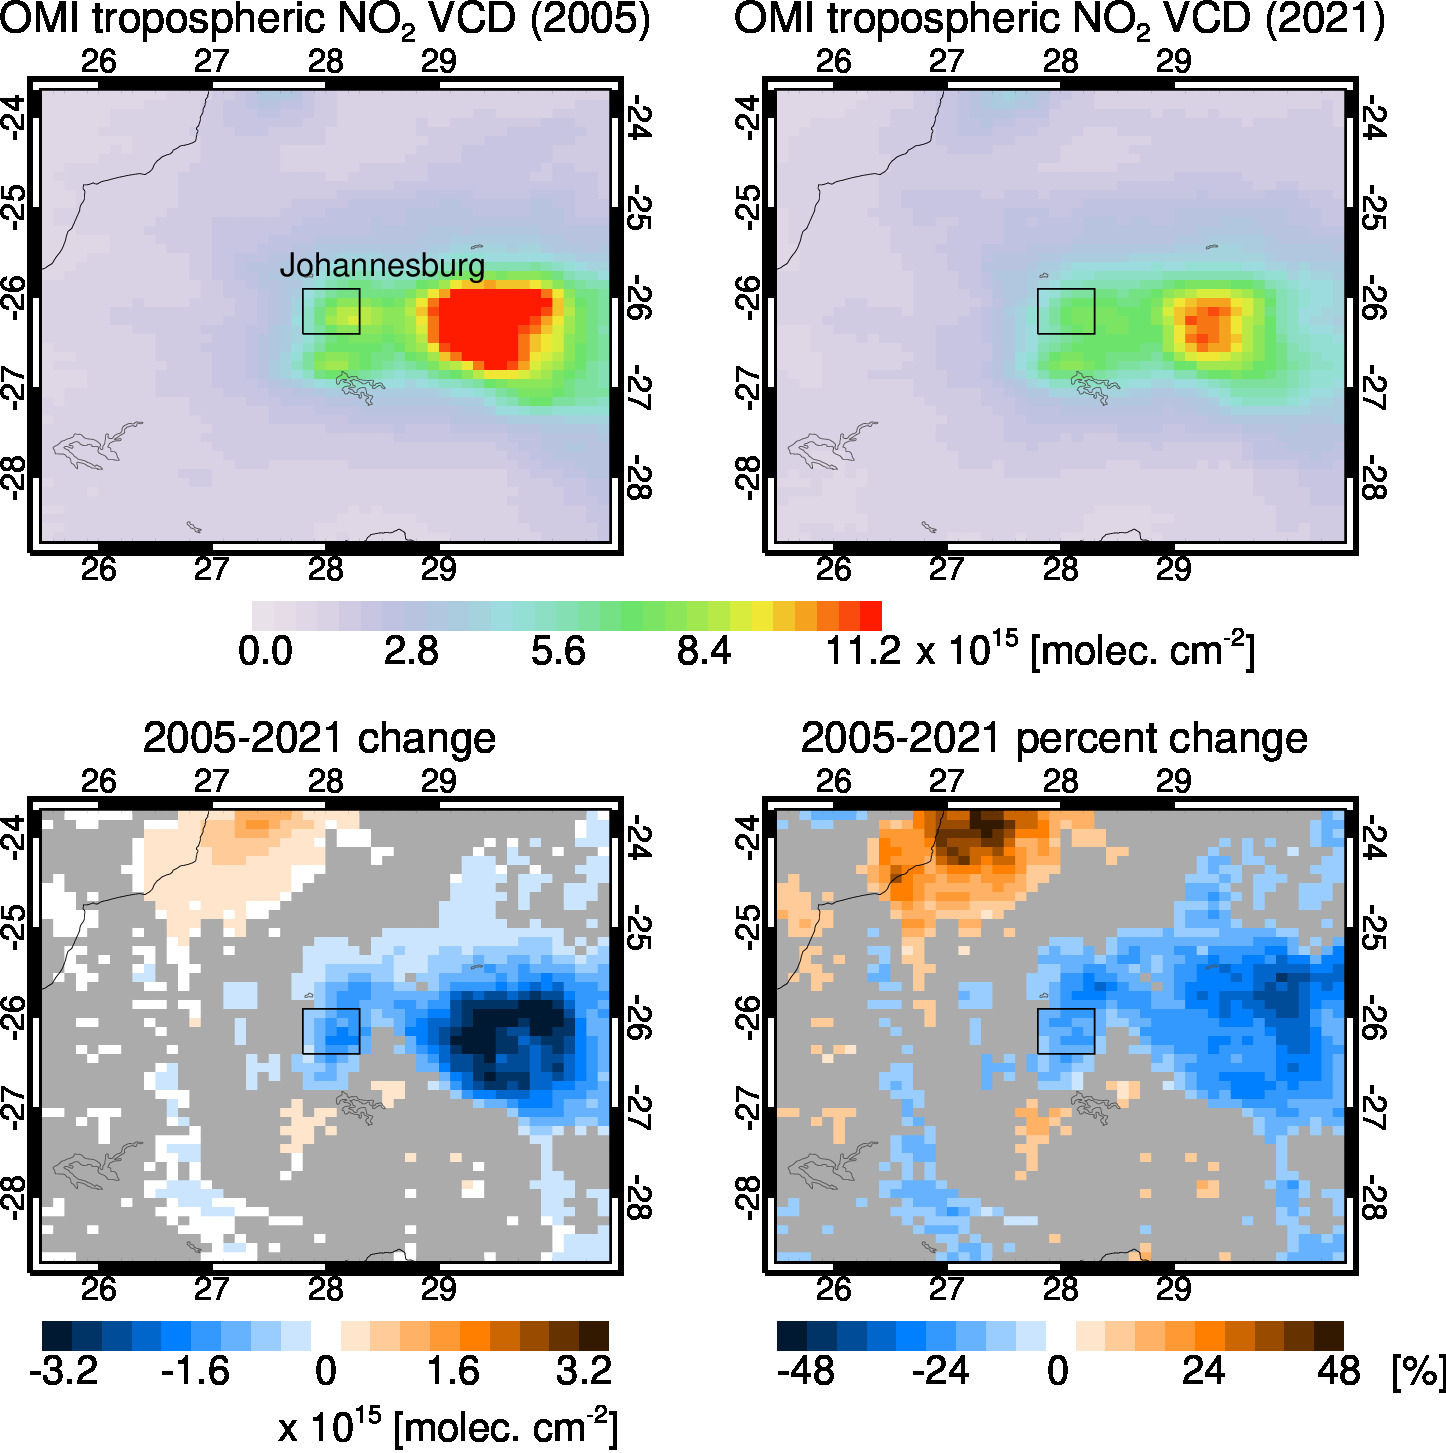
Johannesburg City Trend 2005-2021
Johannesburg OMI data between 2005-2021.