

Kuwait City
Country:
Kuwait
Year:
2014
Average NO2:
6.40
Uncertainty (±%):
7.01
Image
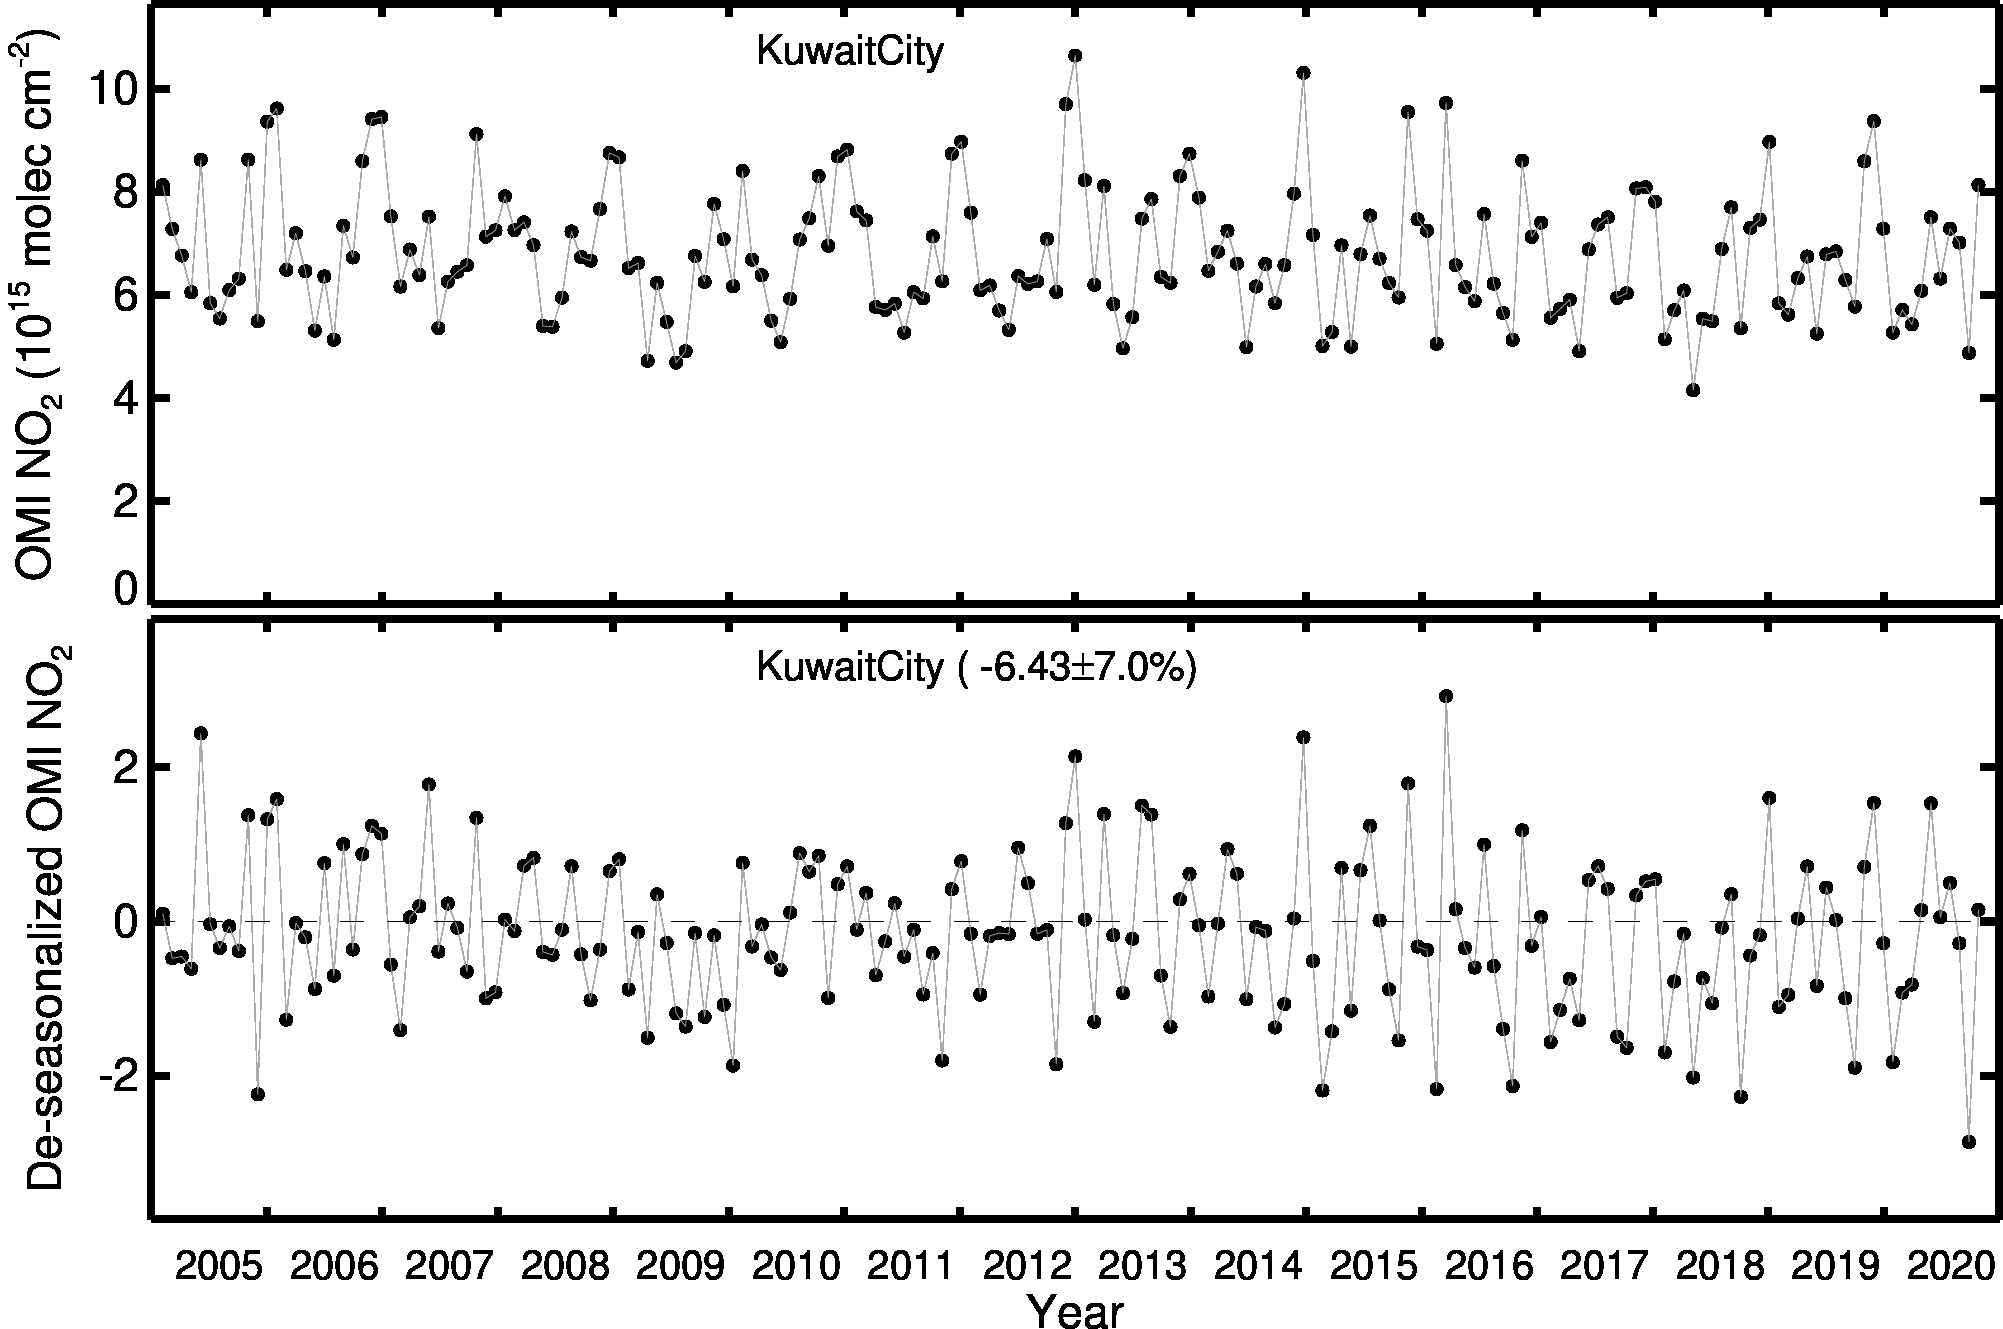
Kuwait City Line Plot 2005 2020
Monthly OMI Nitrogen Dioxide data (top panel) and de-seasonalized data (bottom panel) from 2005 to 2020 for Kuwait.
Image
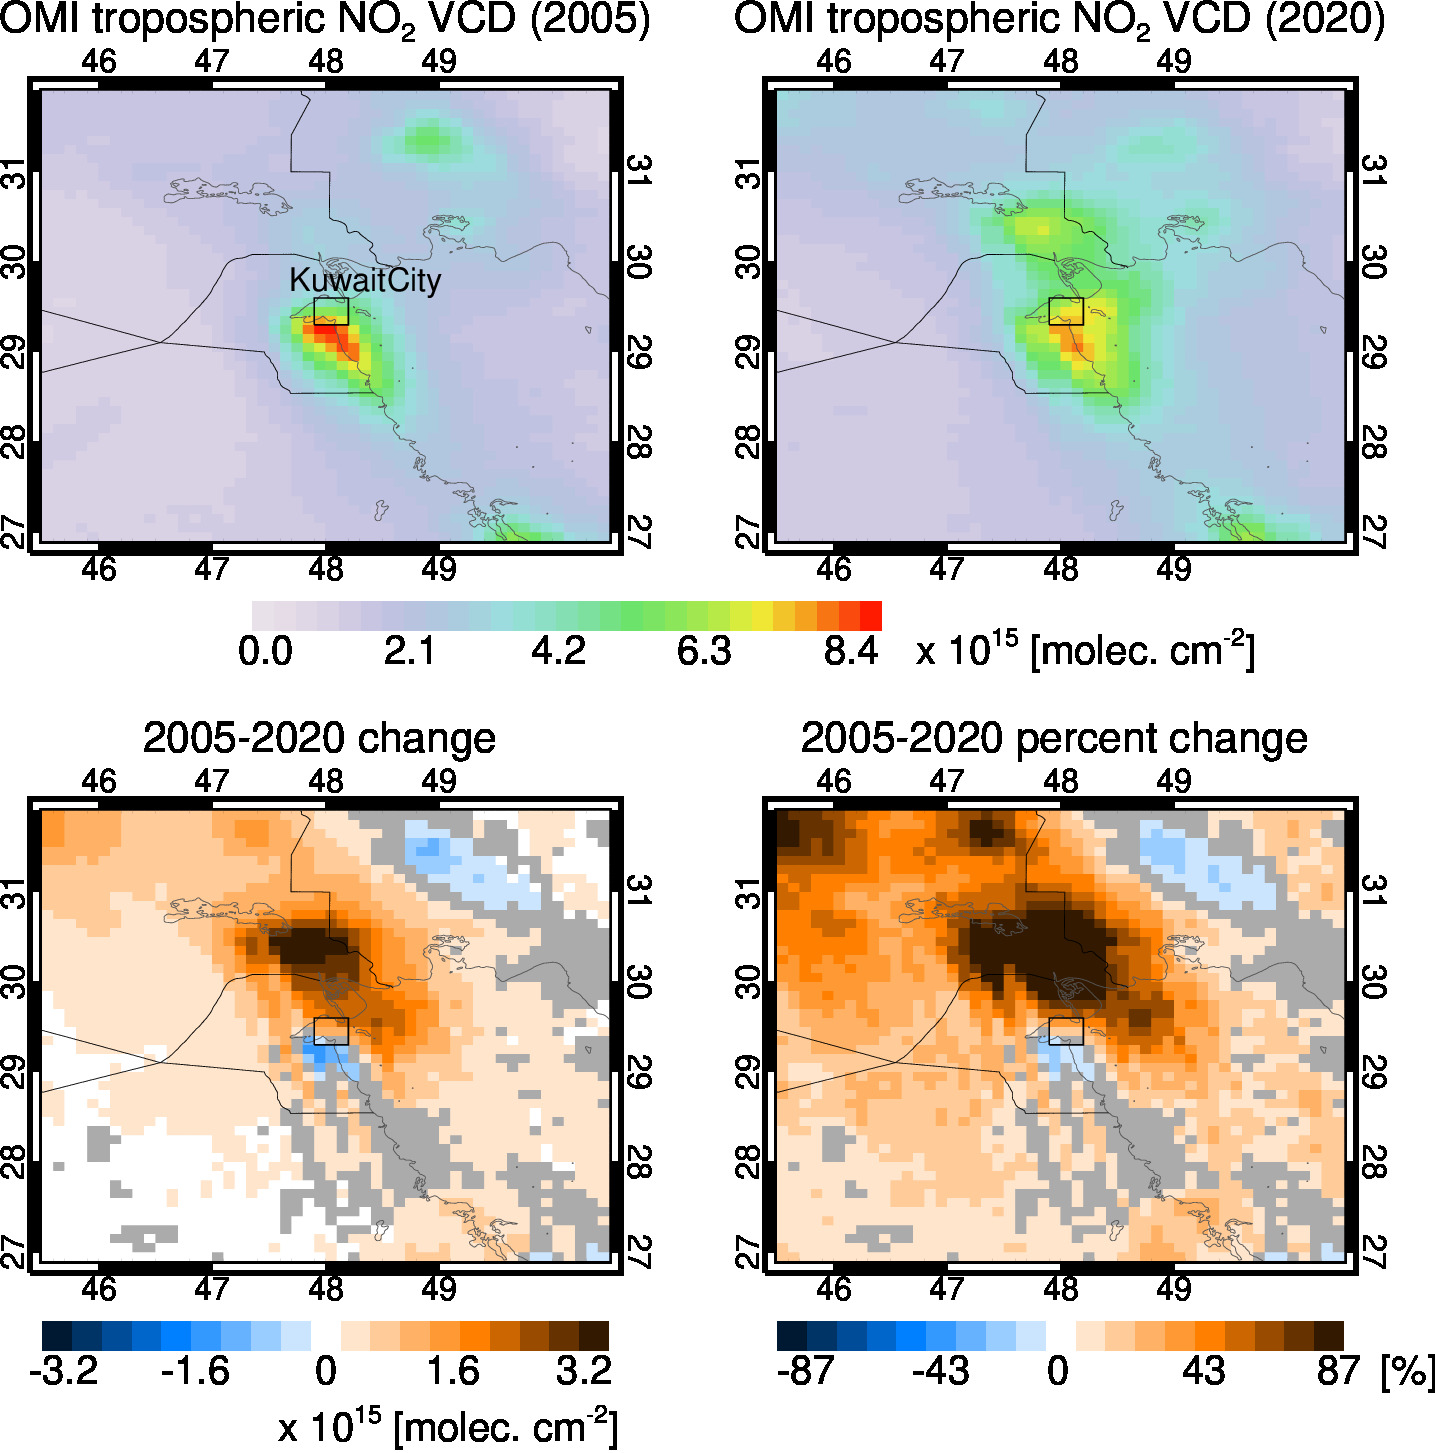
Kuwait City City Trend 2005 2020
Kuwait Metro Comparison of OMI versus AQS data between 2005-2020.