

Air Pollution Effects on Crops: Magnitude of the Problem
Since human population is projected to grow to 8.5 billion by 2030 (UN), scientists are working to gain important knowledge of how to achieve necessary food resources. Food security initiatives largely focus on issues like water resources, nutrition, and disruptions to food distribution systems.
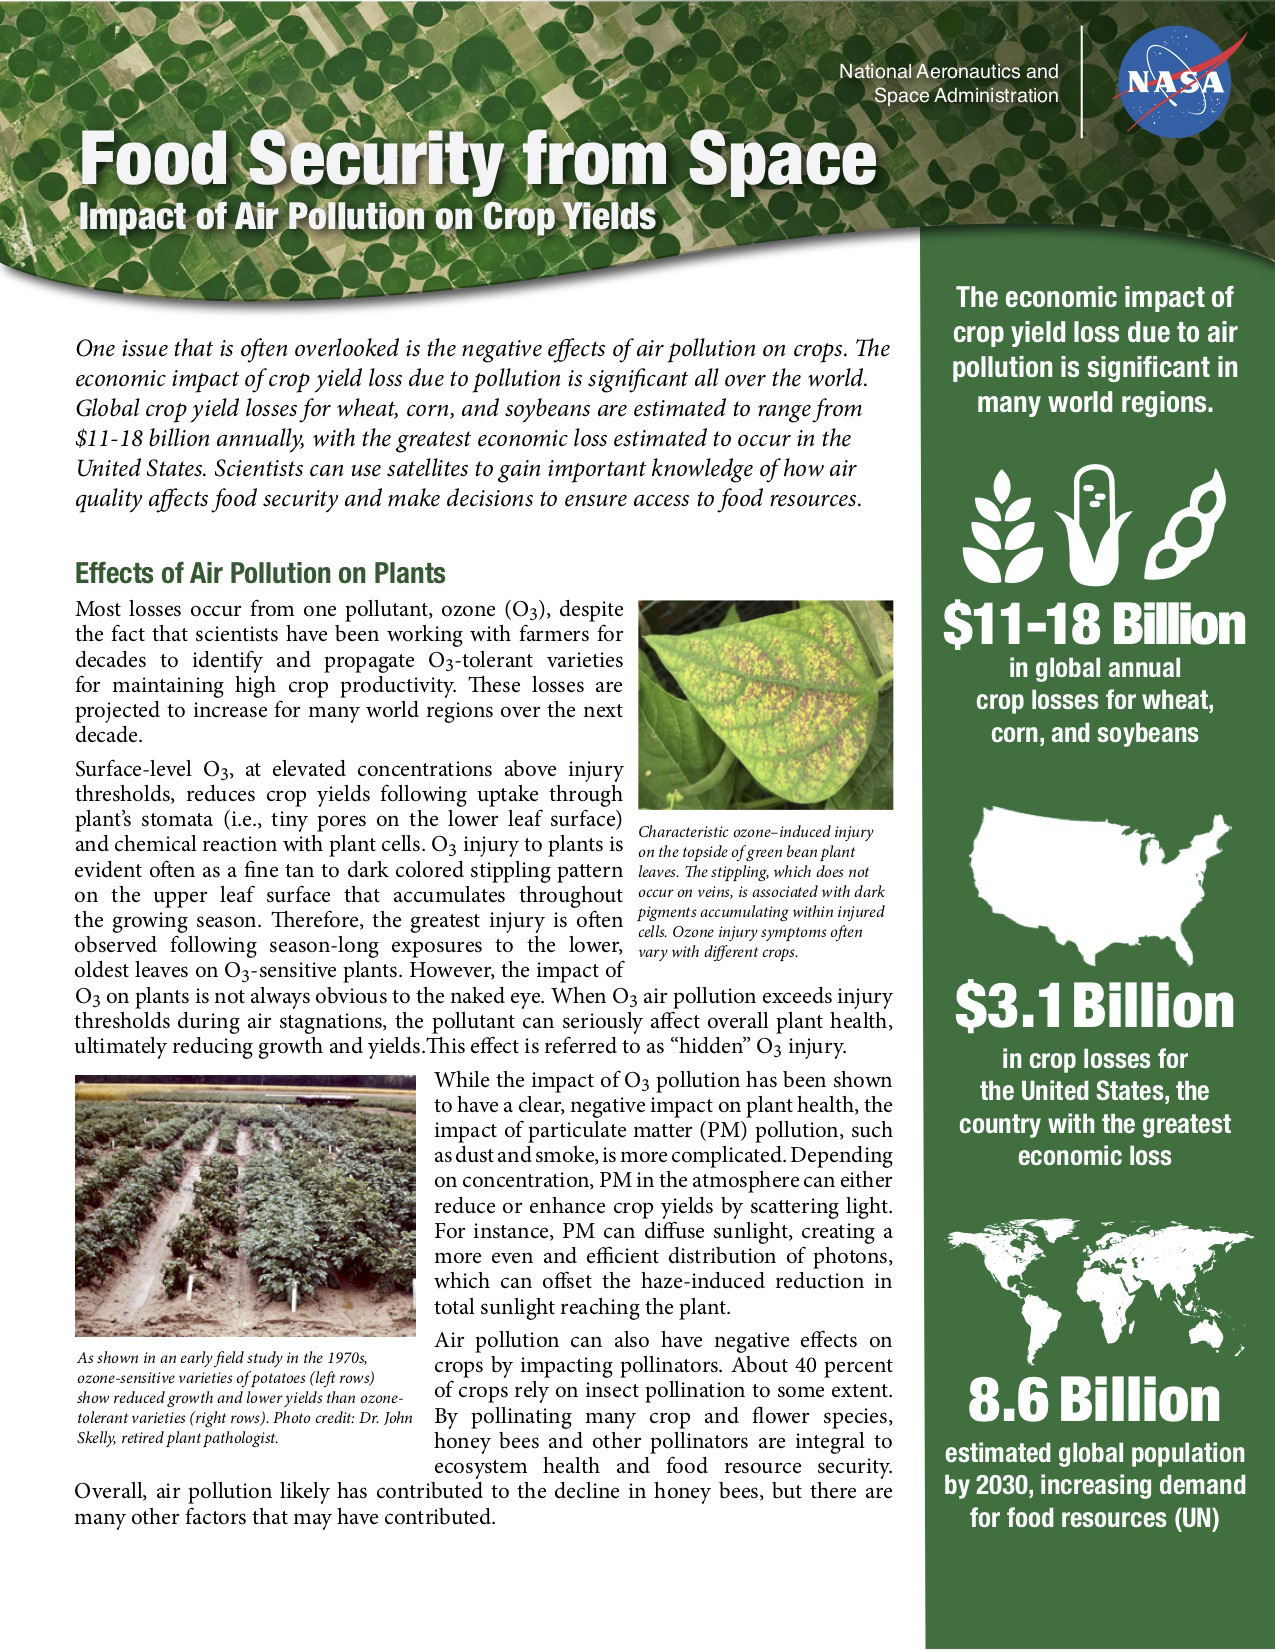
One issue that is often overlooked is the negative effects of air pollution on crops. The economic impact of crop yield loss due to pollution is significant all over the world. Global crop yield losses for wheat, corn, and soybeans (Table 1) are estimated to range from $11-18 billion annually, with the greatest economic loss estimated to occur in the United States ($3.1 billion). Most economic crop losses continue to occur from one major air pollutant, ozone (O3), even though scientists within universities and numerous major agricultural crop industries continue to identify, select, and then propagate ozone tolerant varieties for maintaining highest crop productivity at the farm level. These losses are projected to increase for many world regions (Table 2).
Click on the icon to access a fact sheet that give an overview of the impacts of air pollution on crop yields around the world and shows how NASA satellites are providing important data to scientists and policy makers, who make decisions to ensure global access to food resources.
Table 1. Estimates of the O3 impact on crop yields for Year 2000 (Averny et al., 2011a). Table not currently viewable on small screens.
| Crop | Global | North America | East Asia | South Asia | Africa & Middle East |
| Wheat | 9.6% | 6.8% | 9.8% | 17.4% | 13% |
| Corn | 3.9% | 3.6% | 5.9% | 5.7% | 1.6% |
| Soybeans | 11.2% | 14.4% | 22.8% | 8.2% | 5.9% |
Table 2. Possible future O3 impact on crop yields under IPCC upper and lower boundary projections scenarios for 2030 (Averny et al., 2011b). Table not currently viewable on small screens.
| Crop | Global | North America | East Asia | South Asia | Africa & Middle East |
| Wheat | 10.6-15.6% | 5.1-8.8% | 11.4-14.7% | 21.5-27.8% | 13.9-22.4% |
| Corn | 4.3-6.5% | 3.0-5.3% | 8.0-10.6% | 9.1-12.5% | 2.2-3.4% |
| Soybeans | 12.1-16.4% | 12.2-17.8% | 31.0-38.0% | 13.1-18.8% | 8.2-12.2% |
Manifestation of O3 Injury to Plants
Surface-level O3, at elevated concentrations above injury thresholds, reduces crop yields following uptake through plant’s stomata (i.e., tiny pores on the lower leaf surface) and chemically reacts with plant cells. O3 injury to plants is evident often as a fine tan to dark colored stippling pattern on the upper leaf surface that accumulates throughout the growing season. Therefore, the greatest injury is often observed following season-long exposure to the lower, oldest leaves on O3-sensitive plants.
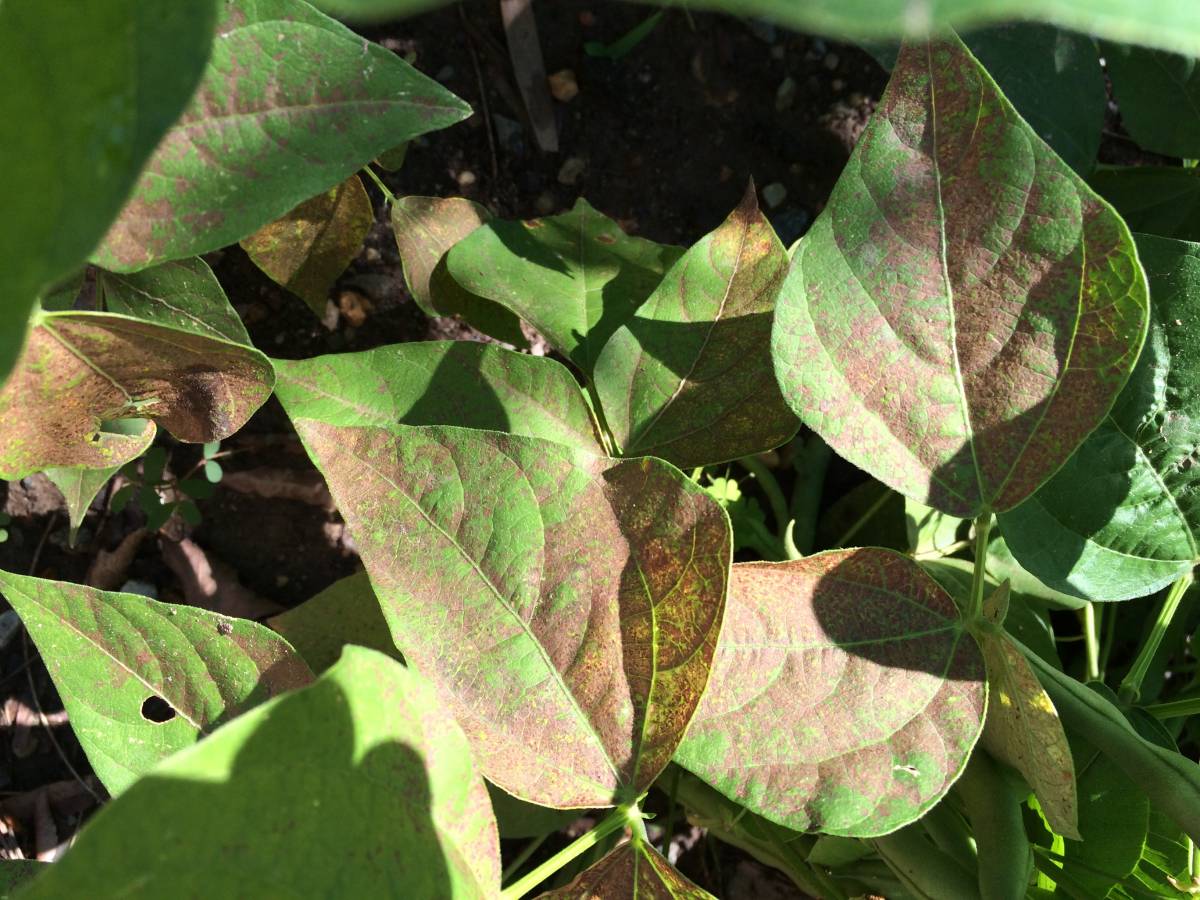

Characteristic O3-induced injury on the topside of (top) green bean and (bottom) coneflower plant leaves. The stippling, which does not occur on veins, is associated with dark pigments accumulating within injured cells. O3 injury symptoms vary with species. Photo credit: Dr. Bryan Duncan, NASA.
However, the impact of O3 on plants is not always obvious to the naked eye. For instance, when O3 air pollution exceeds injury thresholds during air stagnations, the pollutant can seriously affect overall plant health, ultimately reducing growth and yields.
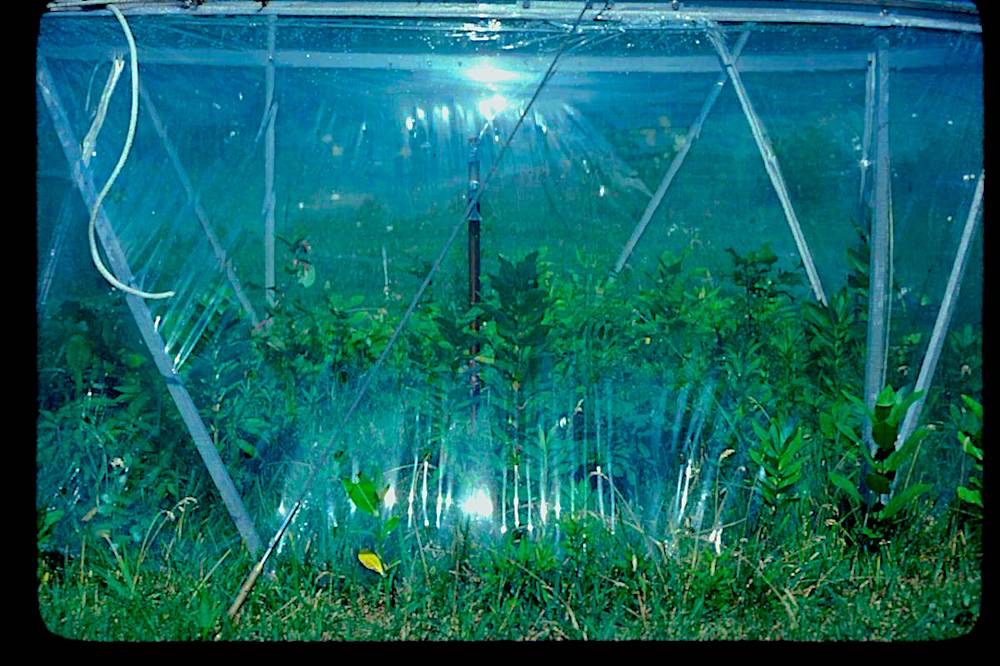

The plants in the chamber on the left were exposed to ambient O3 levels, while O3 was filtered from air in the chamber on the right. The difference in growth is referred to as "hidden" O3 injury. Photo credit: Dr. John Skelly, retired plant pathologist.

As shown in an early field study in the 1970s, O3-sensitive varieties of potatoes (left rows) show reduced growth and lower yields than O3-tolerant varieties (right rows). Photo credit: Dr. John Skelly, retired plant pathologist.
While the impact of O3 pollution has been shown to have a clear, negative impact on plant health, the impact of particulate matter (PM) pollution, such as dust and smoke, is more complicated (e.g., Schiferl and Heald, 2018). Depending on concentration, PM in the atmosphere can either reduce or enhance crop yields by scattering light. For instance, PM can diffuse sunlight, creating a more even and efficient distribution of photons, which can offset the haze-induced reduction in total sunlight reaching the plant.
Air pollution can also have negative effects on crops by impacting pollinators. By pollinating many crop and flower species, honey bees and other pollinators are integral to ecosystem health and food resource security. Crops vary on their dependence on pollination, ranging from completely dependent to not at all. About 40 percent of crops rely on insect pollination to some extent. Overall, air pollution likely has contributed to the decline in honey bees, but there are many other factors that may have contributed. See this report for more details.
Global Food Security and NASA Satellite Data
The NASA Food Security Program explores innovative ways to apply Earth observations to inform food security. NASA Goddard Space Flight Center’s Food Security Office partners with Harvest, a multidisciplinary NASA-funded consortium led by the University of Maryland to advance sustained uses of Earth observations to improve agricultural decision-making.
Additionally, the Agricultural Model Intercomparison and Improvement Project (AgMIP) has the goal to substantially improve the characterization of world food security as affected by climate variability and change, and to enhance adaptive capacity in both developing and developed countries.
Scientific Literature on Air Pollution Impacts on Crops & Ecosystems