

NASA's Fleet of Earth Observing Satellites: Monitoring Our Planet's Health
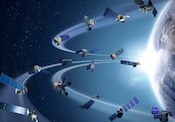
NASA has a fleet of Earth-observing satellites whose instruments observe our planet's oceans, biosphere, and atmosphere. Several of these satellites have instruments that observe trace gases around the world. The data collected are being used by air quality managers and researchers studying the impact of trace gases on human health and agriculture.
Trace gases Observed from Space
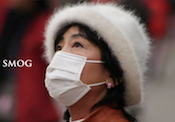
Nitrogen Dioxide (NO2): NO2 is unhealthy to breathe and is primarily generated during fossil fuel combustion, so thermal power plants and automobiles are the dominant sources.
Ozone (O3) & Precursors: At Earth's surface, O3 is unhealthy to breathe and also negatively impacts plants, reducing crop yields.
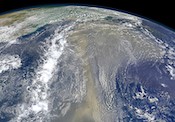
Particulate Matter (PM) & Precursors: PM are tiny particles (e.g., smoke and dust) that cause numerous health issues when breathed in.
Impacts of Trace Gases: How Satellite Data Can Help
Human Health: Exposure to outdoor trace gases is responsible for an estimated 4 million premature deaths annually with about another 3-4 million resulting from exposure to indoor trace gases; that is, trace gases are responsible for about 1 in 9 deaths worldwide (WHO, 2018; Cohen et al., 2017). The State of the Global Air webtool allows you to view historical trends of trace gases for your city with the concomitant impacts on human health.
Agriculture: The economic impact of crop yield loss due to trace gases is significant all over the world. Trace gases cause global crop yield losses for wheat, corn, and soybeans that are estimated to range from 11-18 billion dollars annually, with the greatest economic loss estimated to occur in the United States (3.1 billion dollars).
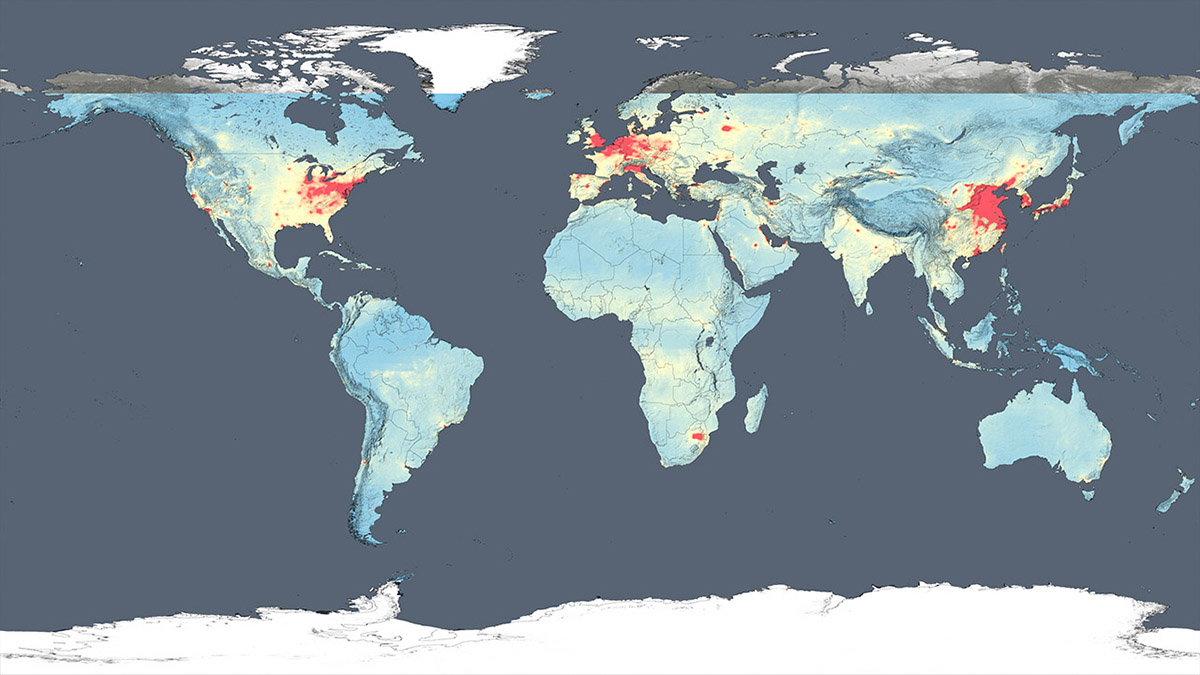
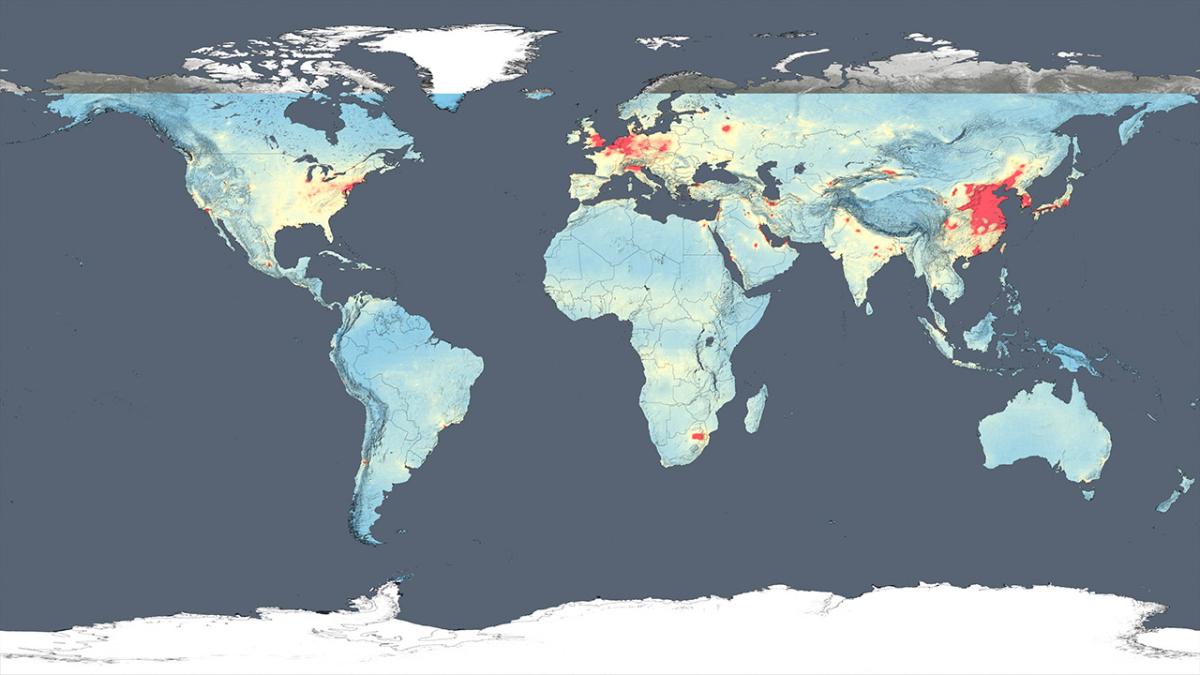
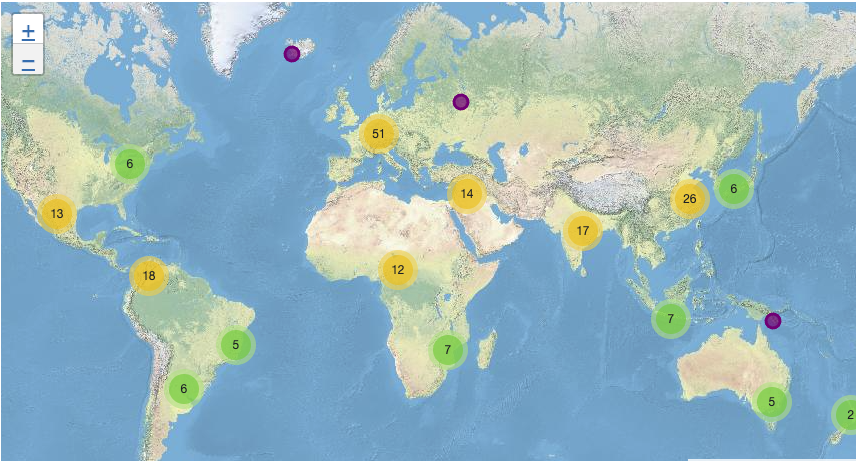
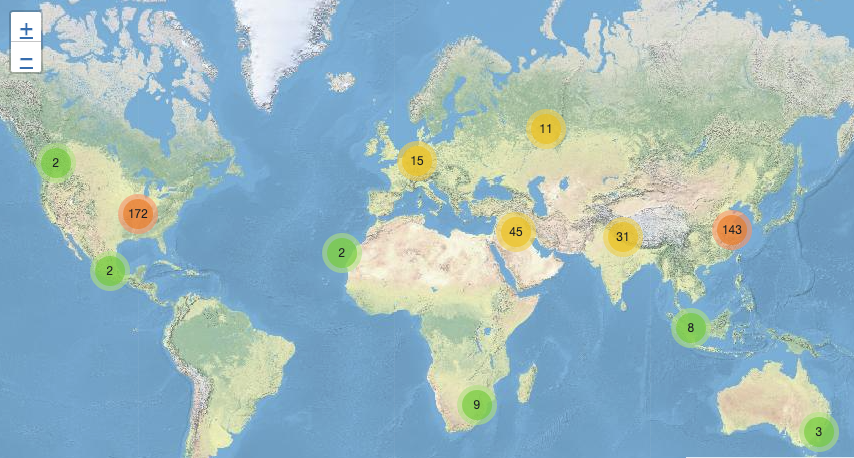
The slider above shows satellite data of nitrogen dioxide (NO2) from the Aura Ozone Monitoring Instrument (OMI) data for two years, 2005 (left) and 2016 (right). The data indicate that levels of this trace gas changed significantly over the last decade in many places around the world. Slide the bar from back and forth to see these changes. More information on NO2 trends for each region and more than 300 world cities can be found under the Nitrogen Dioxide tab.
COVID-19 Impacts on Global Trace Gases
Efforts to contain the spread of COVID-19 led to unprecedented changes in trace gases levels around the world, which NASA satellites observed. Professionals from a number of disciplines have used these data to assess the impact of the pandemic. As an example, onetrace gas, nitrogen dioxide (NO2), is unhealthy to breathe and also a tracer of human activities as it is emitted during fossil fuel combustion. Here are a few examples of how NO2 data were used:
- Air quality managers were interested in NO2 data to assess the impact of lockdowns on trace gases levels.
- Health professionals used NO2 data to gauge the effectiveness (e.g., reduction in emissions from traffic and industry) of lockdown efforts to contain or slow the pandemic in a given area.
- Given that most world economies are driven by fossil fuels, economists used NO2 data, a non-traditional source of data for this community, to assess the impact of the pandemic on economic activity around the world, including in countries without reliable economic data.
- The global intelligence community likely used NO2 data for assessing the impact of the pandemic on world countries, including with world governments that purposely misrepresent or withhold the true extent of the pandemic’s impact.
Learn more about impacts from COVID-19
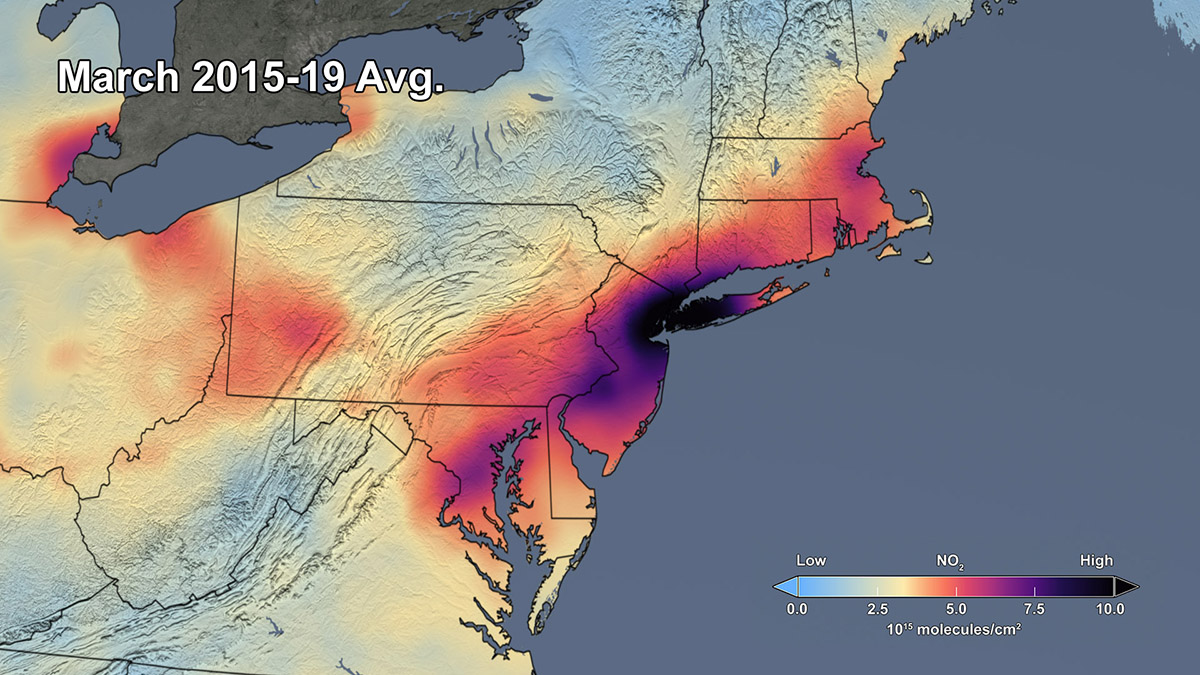
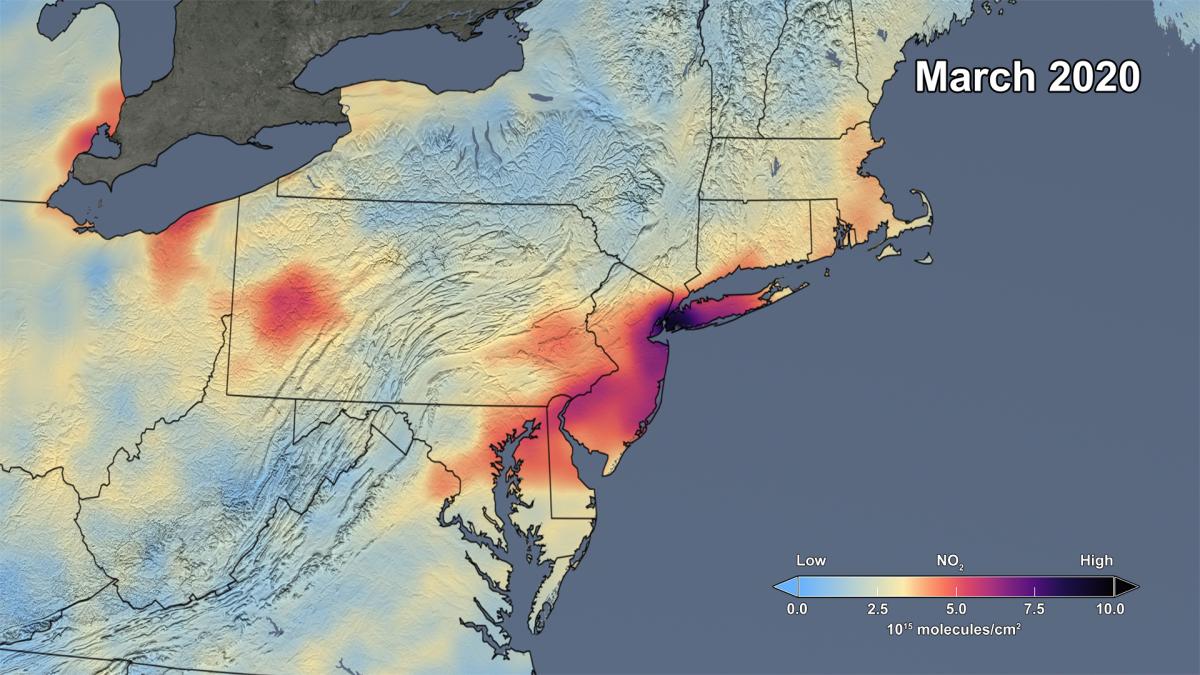
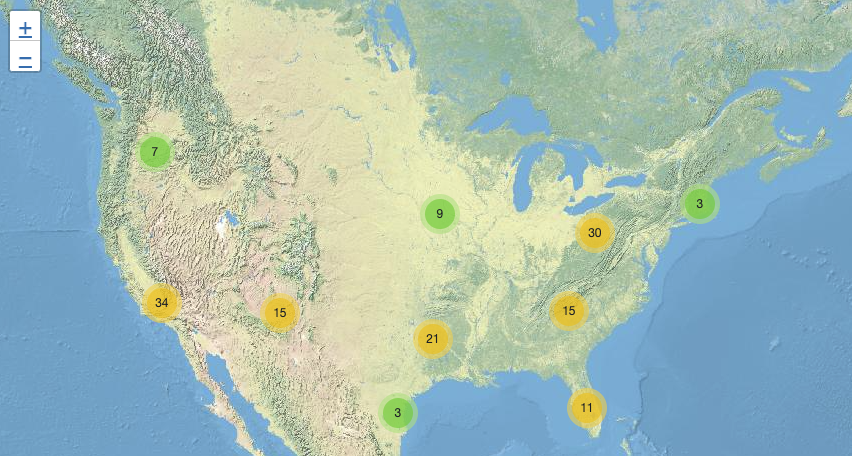
The slider above shows satellite data of NO2 from the Aura Ozone Monitoring Instrument (OMI) over the Northeast United States. The image on the left shows the mean of the period from 2015 through 2019, while the image on the right shows the mean for 2020, during the pandemic lockdowns. Though variations in weather from year to year cause variations in the monthly means for individual years, March 2020 shows the lowest values as compared to any of the monthly values for March during the OMI data record, which spans 2005 to present. In fact, the data indicate that the NO2 levels in March 2020 are about 30% lower on average across the region of the I-95 corridor from Washington, DC to Boston than when compared to the mean of 2015 to 2019.
NASA HAQAST
NASA Health & Air Quality Applied Sciences Team (HAQAST) - HAQAST team members will work with you on your air quality issues using a combination of satellite data, surface data, and models.

NASA ARSET
NASA Applied Remote SEnsing Training (ARSET) - The ARSET program offers free webinars and in-person trainings on the use of NASA satellite data.
NASA Food Security Initiative
The NASA Goddard Space Flight Center's Food Security Initiative promotes the use of Earth observations and Earth science data, models, and knowledge provide essential information and tools to support global food security. (Photo by Ishay Botbol from Pexels)
NASA AQ Forecast
The NASA Global Modeling and Assimilation Office (GMAO) develops and maintains the GEOS system of models, which has a suite of capabilities including simulating weather and trace gases. Visualize the forecast output with FLUID.
NASA Applied Sciences
The NASA Applied Sciences Health & Air Quality (AQ) Program promotes innovation in public and private sector organizations to apply NASA satellite data, model products, and scientific findings in air quality management activities that benefit human health and safety.
NASA Nitrogen Dioxide Datasets
Access nitrogen dioxide data and trends for cities around the world. The data are from the NASA Aura satellite, launched in 2004.