

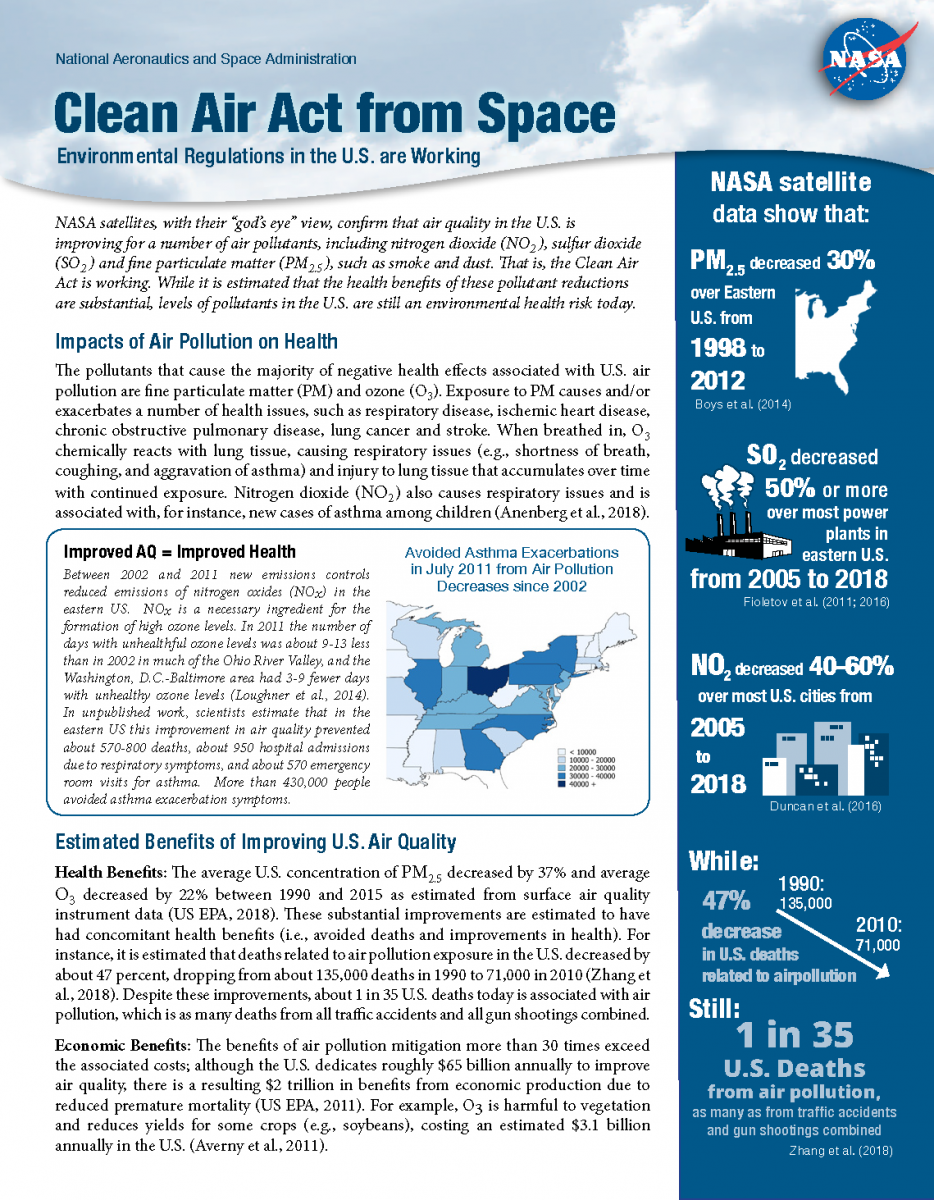
Efficacy of Efforts to Improve Air Quality in the U.S.
Between 1990 and 2015, the U.S. average concentration of PM2.5 decreased by 37% and O3 decreased by 22% (EPA, 2016). These decreased concentrations are expected to have brought substantial benefits for public health in the U.S., but assessing the health benefit requires an understanding of where air quality has improved, relative to where people live. We demonstrate the efficacy of environmental regulations by analyzing time trends of trace gases in the eastern US. We then apply these trends in exposure to trace gases for estimates of health benefits. Specifically, we analyze satellite, ground-based networks, and model concentration trends for ozone (O3), nitrogen dioxide (NO2 – an O3 precursor), particulate matter (PM), and PM precursors, including ammonia (NH3), NO2 and sulfur dioxide (SO2).
⇒ Measuring Trace Gases from Space
Our team has developed a collection of free, publicly-available and downloadable resources (e.g., informational fact sheet, visualizations, summaries, etc.) to aid health and air quality managers to demonstrate the successes of efforts to improve air quality.
Click on the icon to download or view a fact sheet demonstrating that efforts to improve air quality have worked and have had significant benefits for human health.
Trends as Viewed from Space
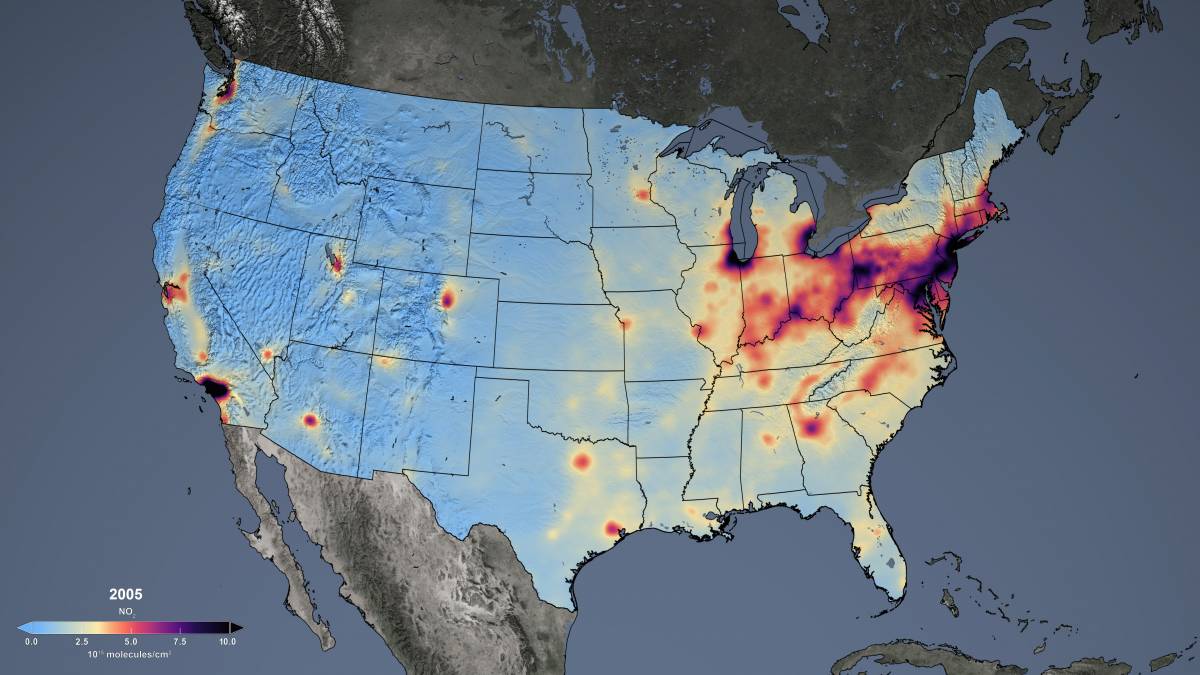
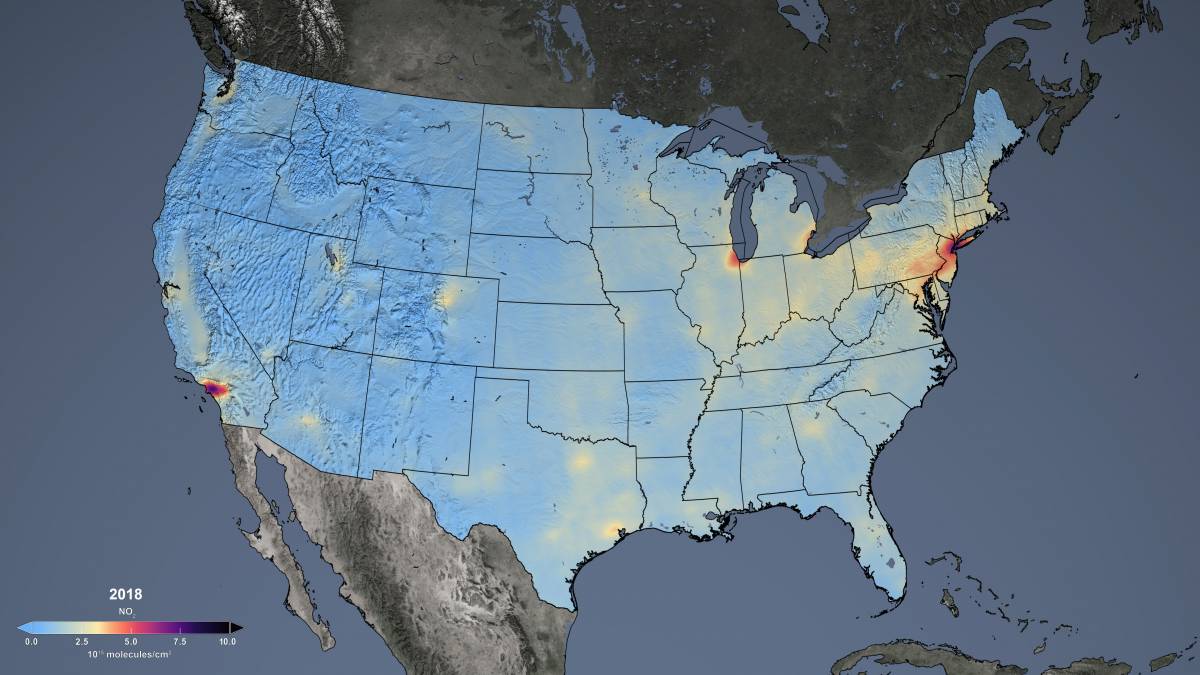
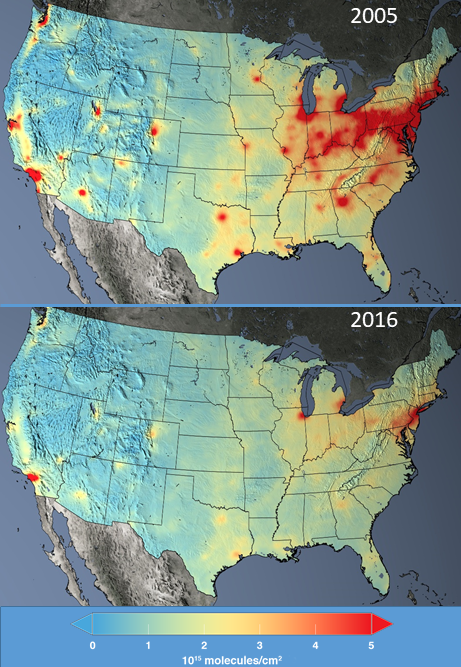
- Images of NO2 over the U.S. for 2005 and 2018.
- Download ready-made plots of satellite NO2 trends (2005-2016) for various U.S. cities.
- Trends (2005-2013) in satellite NO2 over major U.S. power plants.
- A recent study using satellite data of NO2 by Jiang et al. (2018) indicates that the downward trend in NO2 has stalled since about 2011: Jiang et al. (2018), Unexpected slowdown of US trace gas emission reduction in the past decade, Proceedings of the National Academy of Sciences, 201801191; DOI: 10.1073/pnas.1801191115.
- A recent study by Silvern et al. (2019) using satellite data of NO2 suggests that the flattening of the OMI NO2 trend may reflect the increasing relative importance of the non-anthropogenic NO2 background to the tropospheric column, rather than a flattening of US NOx emissions: Silvern et al. (2019), Using satellite observations of tropospheric NO2 columns to infer long-term trends in US NOx emissions:the importance of accounting for the free tropospheric NO2 background, https://doi.org/10.5194/acp-19-8863-2019.
- Animation of annual mean NO2 (satellite data) over the U.S. from 2005 to 2019.
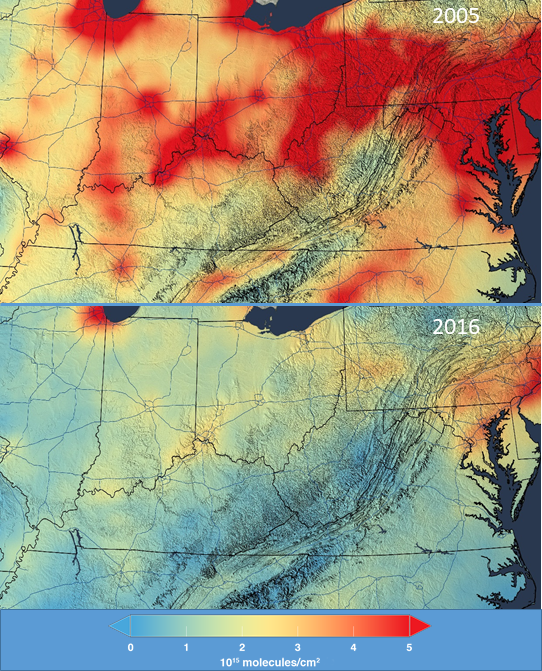
- Still of annual mean NO2 (satellite data) over the Mid-Atlantic/Ohio River Valley and U.S. in 2005 and 2016.
- Satellite data of ozone's chemical precursors show that ozone production has decreased in the eastern U.S. from 2005 to present.
- Satellite data are used to infer surface trends of PM and its chemical precursors, which have decreased in the eastern U.S. from 2005 to present.
- Animation of annual mean SO2 (satellite data) over the eastern U.S. from 2005 to 2017.
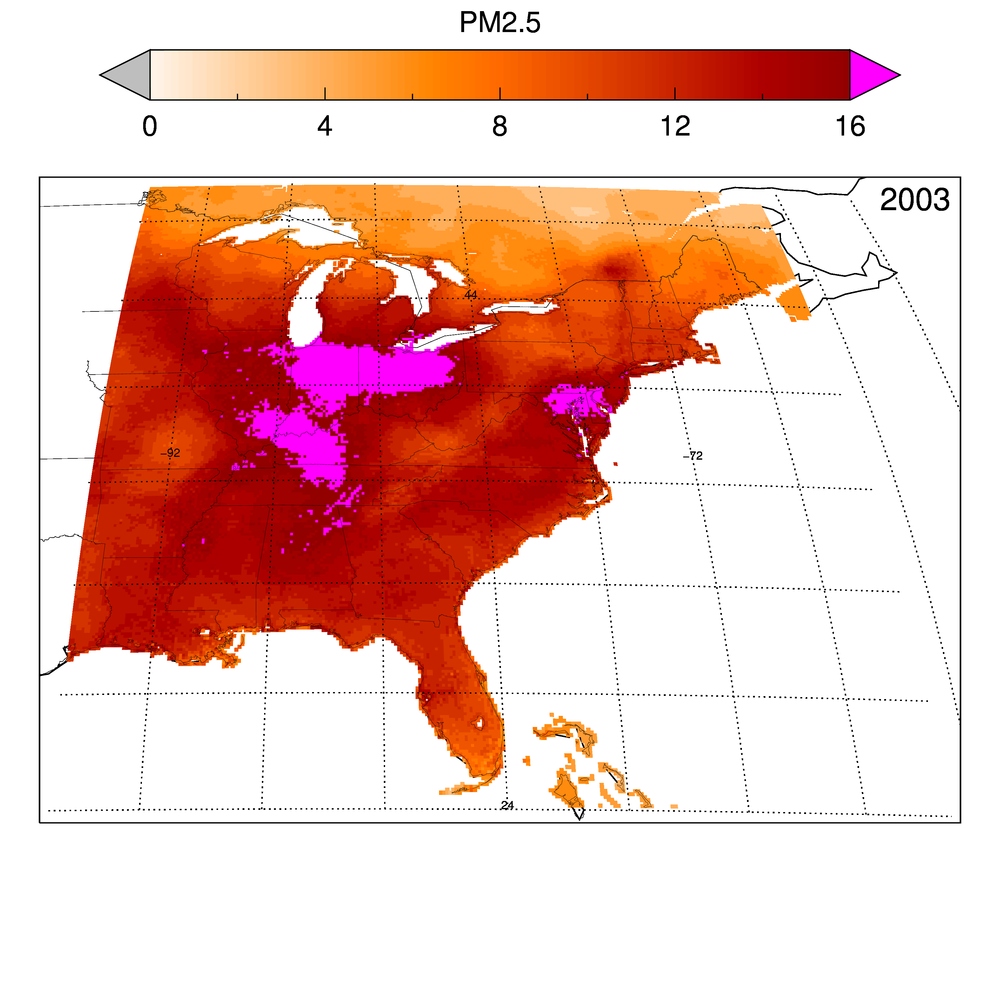
- Animation of annual mean PM2.5 (µg/m3; estimated from satellite data) over the eastern U.S. from 2003 to 2016.
- Satellite data of trends and variations in NH3 show a generally increasing trend in eastern Pennsylvania from 2008 to 2016.
Estimated Benefits of Air Quality Improvements*
*No satellite data were used to estimate these benefits.
Surface PM, O3, & Human Health (1990-2010)
- Jason West (HAQAST) led a recent model (i.e., no satellite data) study (Zhang et al., 2018) that estimates the concomitant health benefits (i.e., avoided deaths) of improvements in U.S. levels of PM2.5 and O3 from 1990 to 2010. Their analyses show that deaths related to trace gases exposure in the U.S. decreased by about 47 percent, dropping from about 135,000 deaths in 1990 to 71,000 in 2010. [press release] [NASA news story] [New York Times article]
Surface O3 & Human Health
- A model study by Loughner et al. (2019) estimated the benefits of trace gases emission reductions on surface ozone concentrations and ozone-related impacts on human health and the economy between 2002 and 2011 during an extremely hot month, July 2011, in the eastern United States (US) using the CMAQ and BenMAP-CE models. Results suggest that, during July 2011, emission reductions prevented 10-15 ozone exceedance days in the Ohio River Valley and 5-10 ozone exceedance days in the Mid Atlantic; saved 160-800 lives in the Eastern US, saving 1.3 - 6.5 billion dollars; and resulted in 950 less hospital admissions for respiratory symptoms, 370 less hospital admissions for pneumonia, 570 less Emergency Room visits for asthma symptoms, 922,020 less minor restricted activity days, and 430,240 less symptoms of asthma exacerbation.
Surface O3, Human Health, & Crop Yields (2000-2015)
- Seltzer et al. (2020) developed and applied artificial neural networks to empirically model long-term O3 exposure over the continental United States from 2000 to 2015, and generated a measurement-based assessment of impacts on human-health and crop yields. Notably, they found that two commonly used human-health averaging metrics, based on separate epidemiological studies, differ in their trends over the study period. The population-weighted, April–September average of the daily 1 h maximum concentration peaked in 2002 at 55.9 ppb and decreased by 0.43 [95 % CI: 0.28, 0.57] ppb yr−1 between 2000 and 2015, yielding an ∼18 % decrease in normalized human-health impacts. In contrast, there was little change in the population-weighted, annual average of the maximum daily 8 h average concentration between 2000 and 2015, which resulted in a ∼5 % increase in normalized human-health impacts. In both cases, an aging population structure played a substantial role in modulating these trends. Trends of all agriculture-weighted crop-loss metrics indicated yield improvements, with reductions in the estimated national relative yield loss ranging from 1.7 % to 1.9 % for maize, 5.1 % to 7.1 % for soybeans, and 2.7 % for wheat. Overall, these results provide a measurement-based estimate of long-term O3 exposure over the United States, quantify the historical trends of such exposure, and illustrate how different conclusions regarding historical impacts can be made through the use of varying metrics.
Economy
- The benefits of trace gases mitigation more than 30 times exceed the associated costs; although the U.S. dedicates roughly 65 billion dollars annually to improve air quality, there is a resulting 2 trillion dollars in benefits from economic production due to reduced premature mortality (US EPA, 2011). The EPA has quantified the benefits of the U.S. Clean Air Act in a report, entitled "Benefits and Costs of the Clean Air Act 1990-2020, the Second Prospective Study."