

Nitrogen dioxide (NO2), which is unhealthy to breathe (e.g., Anenberg et al., 2018; Eum et al., 2019), is a member of the NOx family (NOx = NO + NO2) and is a necessary ingredient for the formation of unhealthy levels of surface ozone (O3), another important trace gas. It is primarily generated during fossil fuel combustion, so thermal power plants and automobiles are the dominant sources.
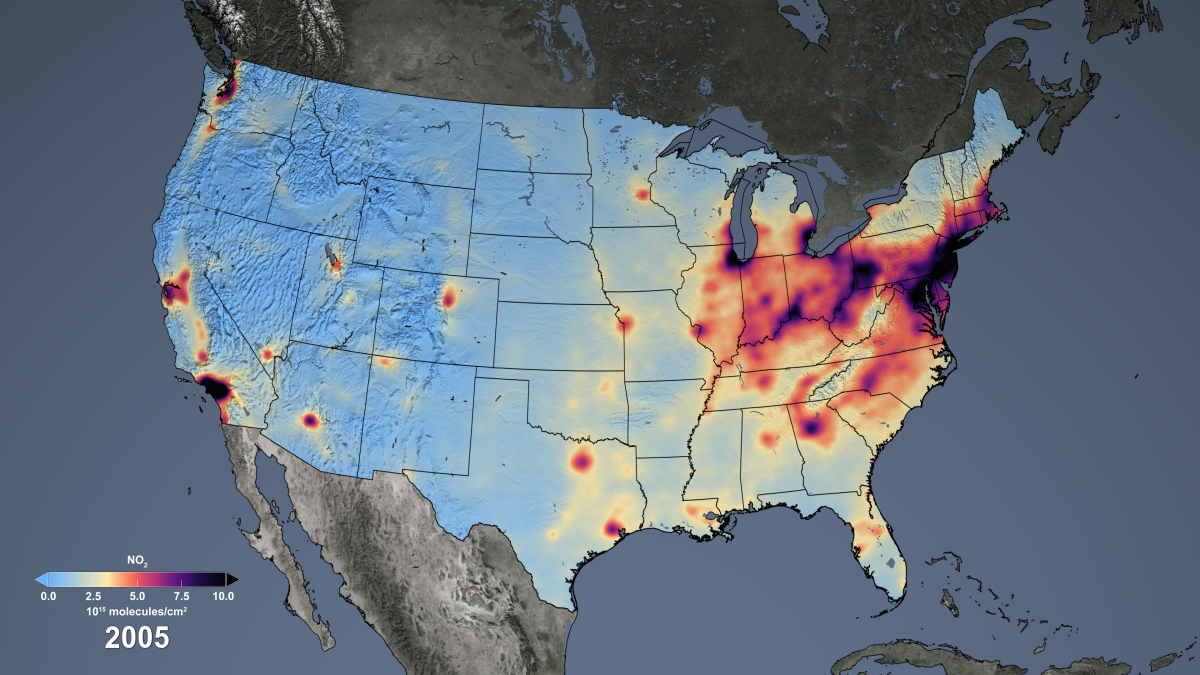
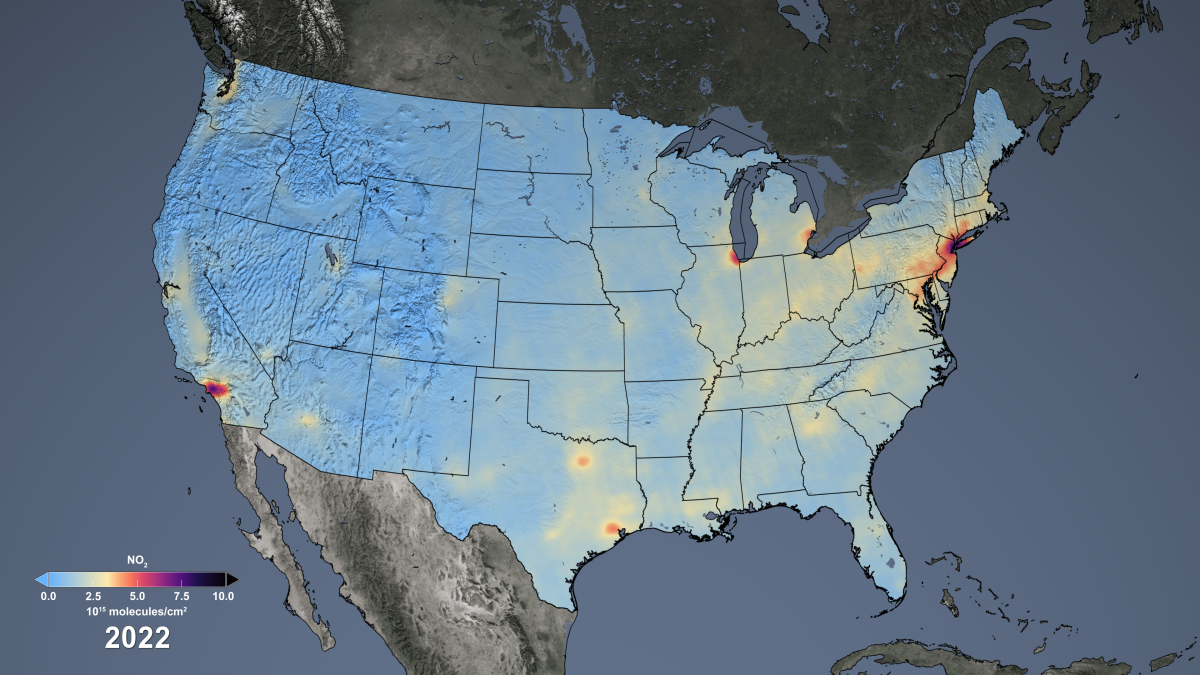
The animation shows changes in NO2 from 2005 to 2022 from data of the Ozone Monitoring Instrument (OMI), a Dutch-Finnish instrument, on the NASA Aura satellite. The large decreases (20-50%) are associated with the implementation of state and federal regulations to reduce NOx emissions from power plants and cars. The only areas of increases occurred over areas of oil and natural gas (ONG) extraction activities in North Dakota and Texas. Former President Obama explains how satellite data show that the Clean Air Act is working in a video from Discovery Channel News. However, a study by Jiang et al. (2018) indicates that the downward trend in NO2 has stalled since about 2011.
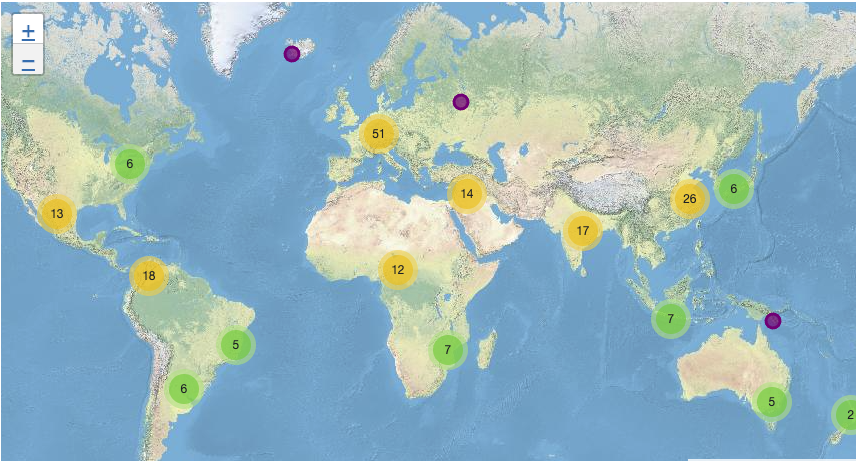
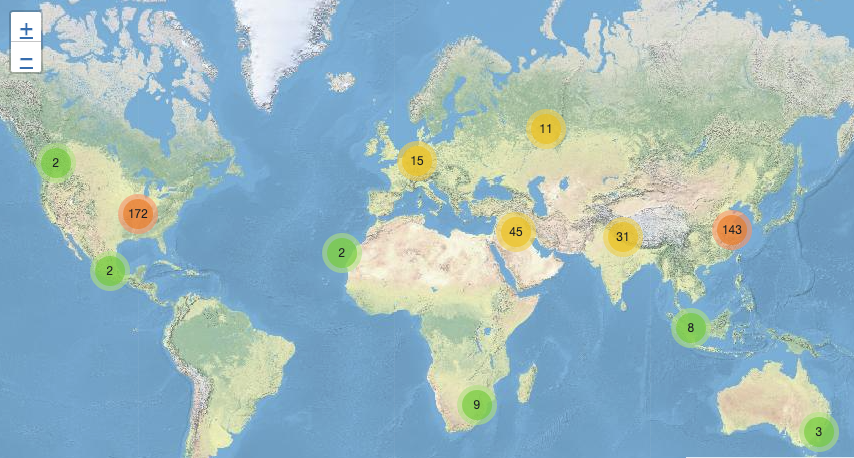
There are also notable changes in NO2 levels around the world (Duncan et al., 2016).
⇒ Efficacy of Efforts to Improve Air Quality in the U.S.
⇒ How to Find and Visualize NO2 Satellite Data
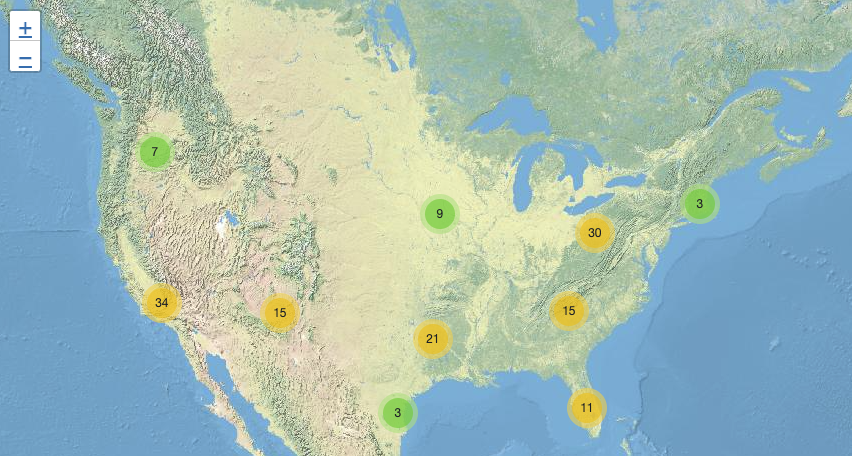
Download NO2 Images for cities, power plants, regions, and the world
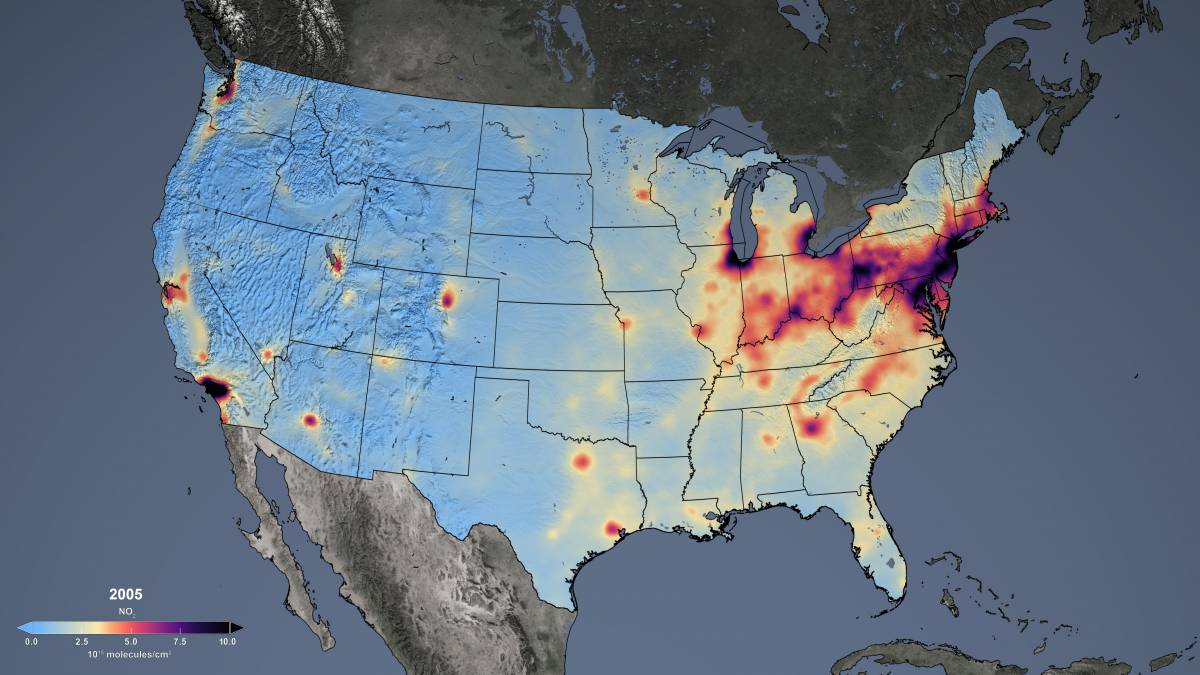
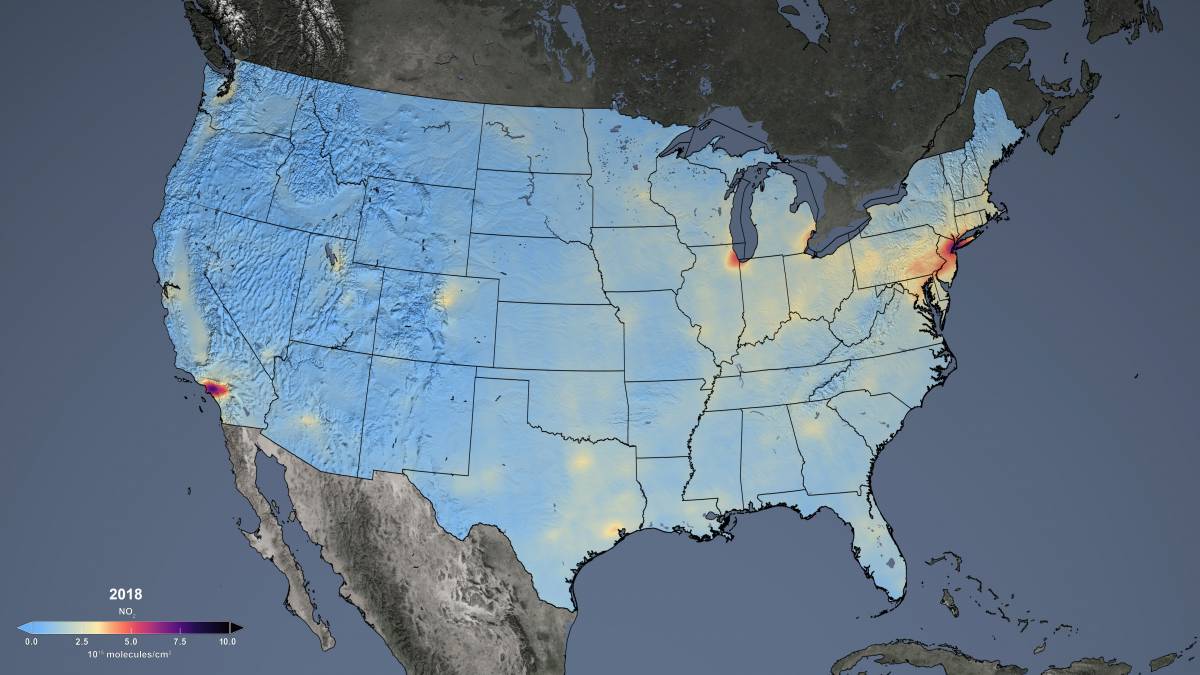
Annual-average NO2 for 2005 and 2018 over the U.S.
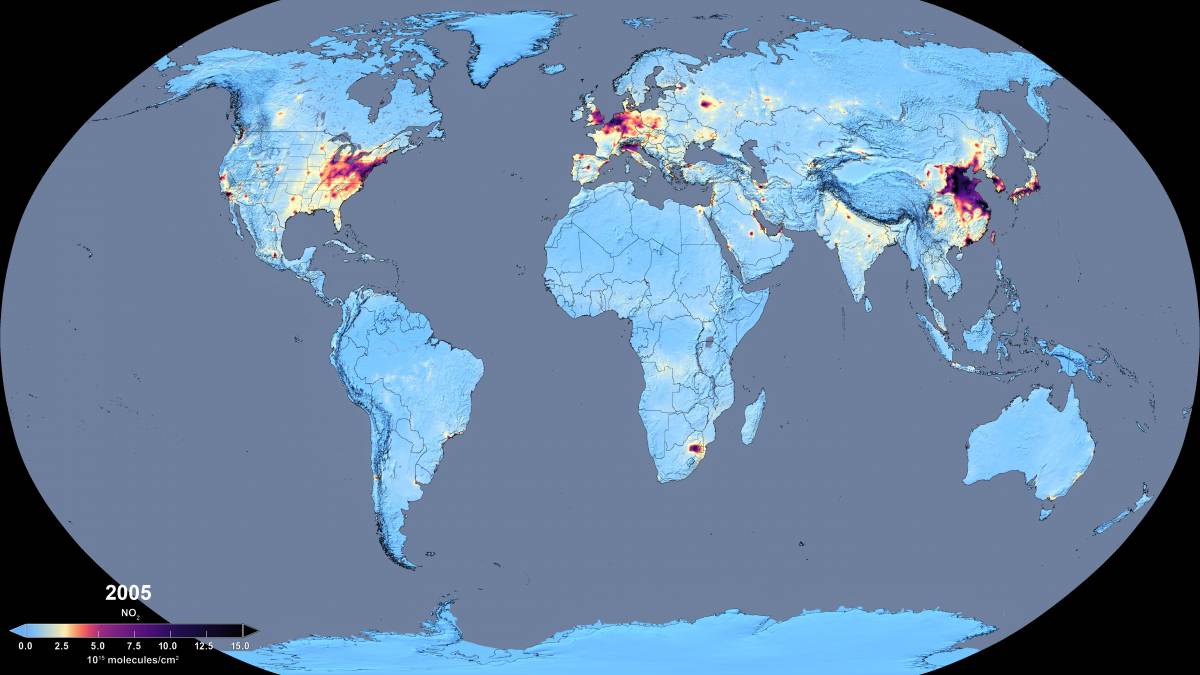
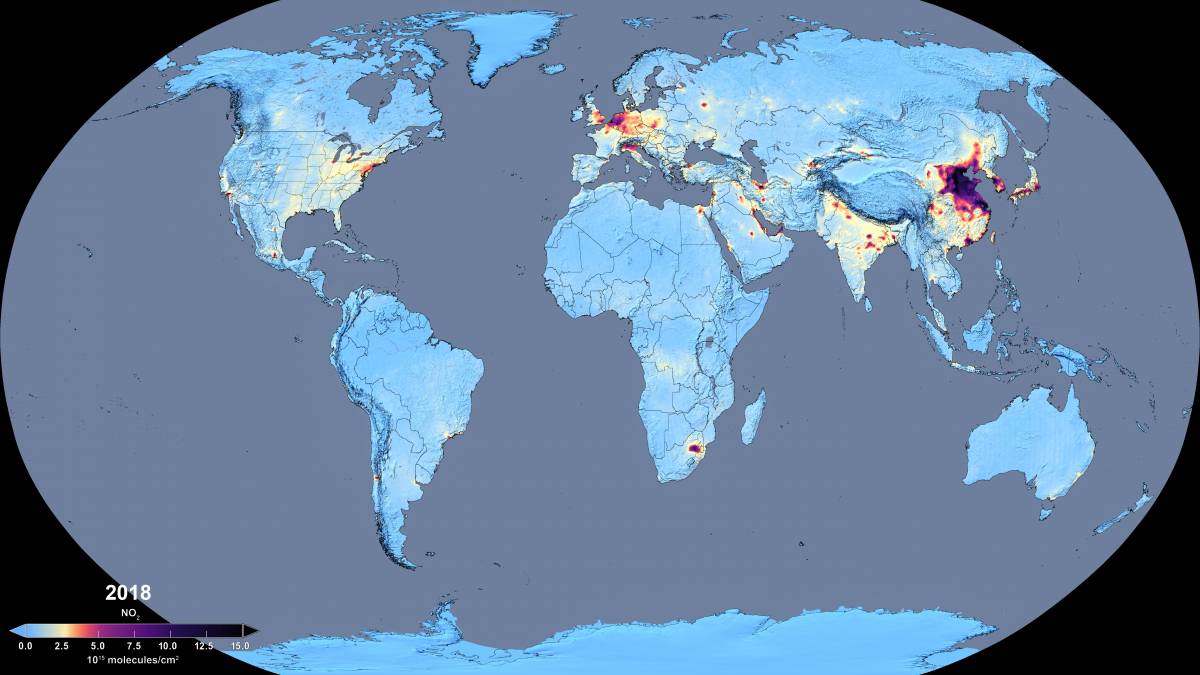
Annual-average NO2 for 2005 and 2018 over the globe.
From the sidebar, you can to download pre-made images of satellite data of NO2 over U.S. power plants and over U.S. and world cities from OMI. The pre-made images include spatial maps, such as trends over time (2005-2018). Visit the News tab for more information, including downloadable videos and images of satellite data of NO2.
Download NO2 Data
- OMI: For scientific studies, OMI NO2 data may be downloaded from the Aura Validation Data Center (AVDC). The Managers tab has a tutorial on how to work with NO2 data.
- TROPOMI: The data are available at the GES DISC.
- The TEMIS website archives NO2 data from past and current sensors.
These papers show how emissions and trends in OMI NO2 data correspond to independent data sources:
- Duncan, B.N., L.N. Lamsal, A.M. Thompson, Y. Yoshida, Z. Lu, D.G. Streets, M.M. Hurwitz, and K.E. Pickering, A space-based, high-resolution view of notable changes in urban NOx trace gases around the world (2005-2014), J. Geophys. Res., doi:10.1002/2015JD024121, 2016.
- Lamsal, L.N., B.N. Duncan, Y. Yoshida, N.A. Krotkov, K.E. Pickering, D.G. Streets, and Z. Lu, U.S. NO2 trends (2005-2013): EPA Air Quality System (AQS) data versus improved observations from the Ozone Monitoring Instrument (OMI), Atmos. Environ., doi:10.1016/j.atmosenv.2015.03.055, 2015.
- Duncan, B., Y. Yoshida, B. de Foy, L. Lamsal, D. Streets, Z. Lu, K. Pickering, and N. Krotkov, The observed response of Ozone Monitoring Instrument (OMI) NO2 columns to NOx emission controls on power plants in the United States: 2005-2011, Atmos. Environ., 81, p. 102-111, doi:10.1016/jatmosenv.2013.08.068, 2013.
- Lamsal, L. N., Krotkov, N. A., Celarier, E. A., Swartz, W. H., Pickering, K. E., Bucsela, E. J., Gleason, J. F., Martin, R. V., Philip, S., Irie, H., Cede, A., Herman, J., Weinheimer, A., Szykman, J. J., and Knepp, T. N., Evaluation of OMI operational standard NO2 column retrievals using in situ and surface-based NO2 observations, Atmos. Chem. Phys., 14, 11587-11609, doi:10.5194/acp-14-11587-2014, 2014.