

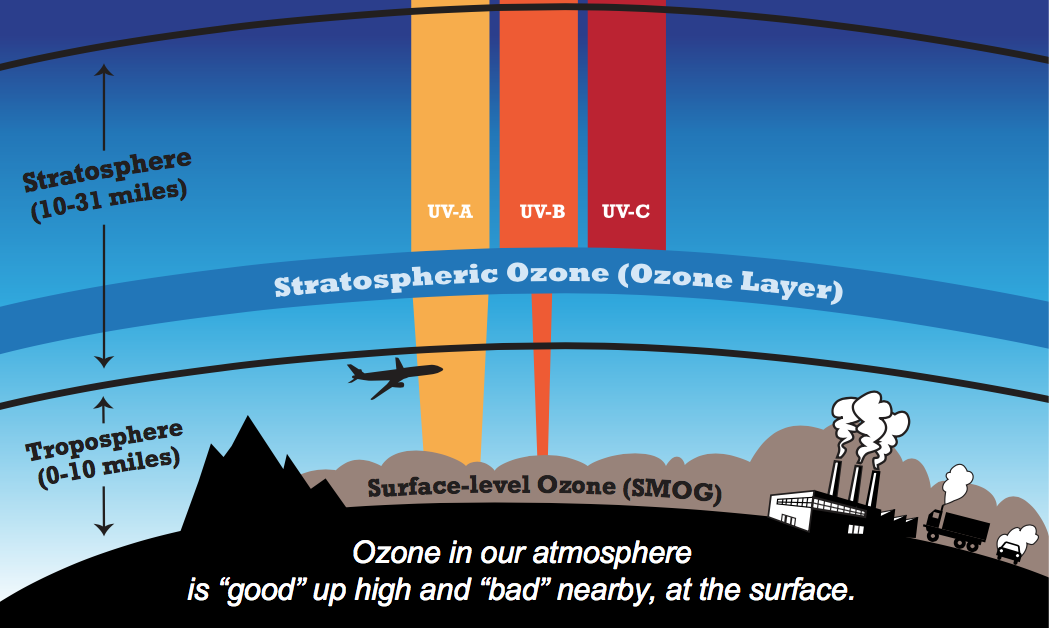
At Earth's surface, ozone (O3) is a trace gas that is not directly emitted into the air, but instead it is formed through chemical reactions in the atmosphere when ultraviolet (UV) radiation from the sun interacts with nitrogen oxides (NOx = NO2 + NO) and volatile organic compounds (VOCs). Both compounds are released to the atmosphere through human actions, such as the burning of fossil fuels. (Surface O3 is not to be confused with the stratospheric "Ozone Layer," which filters out most harmful ultraviolet (UV) rays from the sun.)
When breathed in, O3 chemically reacts with lung tissue, causing respiratory issues and injury to lung tissue that accumulates over time with continued exposure. (In fact, O3 is such a highly reactive gas that is used to disinfect water for drinking.) Exposure to O3 is associated with about 250 thousand deaths annually worldwide (Cohen et al., 2017). O3 is also harmful to vegetation and even reduces yields for some crops (e.g., soybeans), costing billions of dollars annually. It enters a plant’s stomata (i.e., tiny pores on leaves) and chemically reacts with plant cells. O3 injury to plants is evident often as a reddish stippling pattern on the upper side of the leaf surface that accumulates throughout the growing season. For more information on the impacts of O3 on health and plants, visit the Impacts tab.
Assessing the Efficacy of Efforts to Improve Air Quality
Monitoring O3, NOx and VOCs levels over time allows air quality managers to assess the efficacy of efforts, such as the U.S. Clean Air Act, to reduce unhealthy O3 levels. NO2 and many VOCs are considered trace gases as they are unhealthy for humans to breathe, though both are primarily regulated to reduce the formation of unhealthy levels of O3.
⇒ Efficacy of Efforts to Improve Air Quality in the U.S.
For instance, Zhu et al. (2017) used satellite observations of HCHO to estimate that 6,600-13,200 people in the US will develop cancer over their lifetimes by exposure to outdoor formaldehyde (HCHO). For more information, visit the Health Impacts tab.
What can we observe from space?
- O3: With today's technology, it is not currently feasible to monitor surface levels of O3 from space. However, it is possible to observe NOx and VOCs levels from space.
- NOx: NO2 serves as an effective proxy for NOx and is observable from space. For more information on NOx, visit the Nitrogen Dioxide tab.
- VOCs: HCHO, a VOC, is observable from space. It an effective proxy for many VOCs as HCHO is produced when they are oxidized (i.e., broken down) in the atmosphere via chemical reactions. There are typically thousands of VOCs in urban areas, especially cities. Many natural VOCs, such as isoprene, are emitted from vegetation and make a much larger contribution to total VOCs than man-made VOCs in many areas of the Eastern U.S., particularly the Southeast U.S. In fact, most HCHO observed from space is associated with the atmospheric oxidation of isoprene. Plants are thought to emit isoprene in response to stresses, such as high temperatures. Therefore, HCHO levels tend to be higher during hotter days and summers than cooler ones.
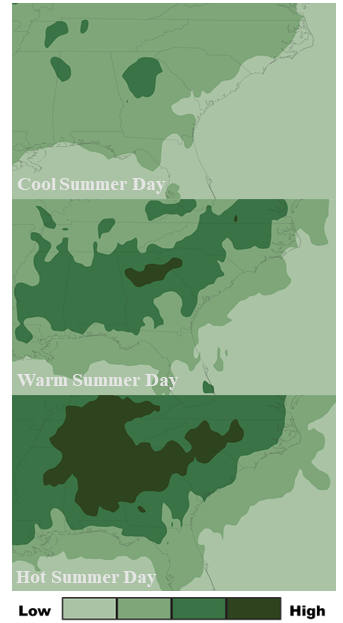
HCHO levels over the Southeast U.S. during three different summer months: a cool one, a warm one, and a hot one. The higher levels are indicated by darker colors. Data are from the Aura Ozone Monitoring Instrument. Figure credit: NASA.
Satellite-based observations of the NO2 to HCHO ratio give air quality managers an indication of the most effective way to reduce surface O3 levels. Should they reduce emissions of NOx, VOCs, or both to lower surface O3 levels? Abundant natural sources of VOCs, such as isoprene, typically make controlling anthropogenic NOx emissions the only viable way to reduce surface O3 in the Eastern U.S. during summer. That is, NOx is the limiting reagent for O3 formation (i.e., NOx-limited), except in urban areas with very high NOx concentrations; in these areas, controlling VOC emissions is often also effective at reducing O3 formation (i.e., radical-limited). However, satellite data indicate that the extent of radical-limited areas has dwindled in the Eastern U.S. given the substantial reduction (20-60%) of NOx emissions over the last 15 years (Jin et al., 2017; NASA Earth Observatory story). For more information on how satellite data of HCHO and NO2 are being used to monitor O3 formation sensitivity, visit the AQ Managers tab to access a tutorial on using the data.
Variation of (left) NO2 levels, (middle) HCHO levels, and (right) HCHO/NO2 as a May-September (i.e., “ozone season”) average from 2005 through 2016. Data are from the Aura Ozone Monitoring Instrument. Figure credit: Dr. Xiaomeng Jin, Colombia University.
The Benefits of the U.S. Clean Air Act for O3 of NOx Emissions Reductions & Human Health
Benefits for O3 & Human Health: NOx emissions have decreased by about 37% in the Eastern U.S. from 2002 to 2011, with reductions as high as 60% in some areas. A model study by Loughner et al. (2019) estimated the benefits of trace gases emission reductions on surface ozone concentrations and ozone-related impacts on human health and the economy between 2002 and 2011 during an extremely hot month, July 2011, in the eastern United States (US) using the CMAQ and BenMAP-CE models. Results suggest that, during July 2011, emission reductions prevented 10-15 ozone exceedance days in the Ohio River Valley and 5-10 ozone exceedance days in the Mid Atlantic; saved 160-800 lives in the Eastern US, saving 1.3 - 6.5 billion dollars; and resulted in 950 less hospital admissions for respiratory symptoms, 370 less hospital admissions for pneumonia, 570 less Emergency Room visits for asthma symptoms, 922,020 less minor restricted activity days, and 430,240 less symptoms of asthma exacerbation.
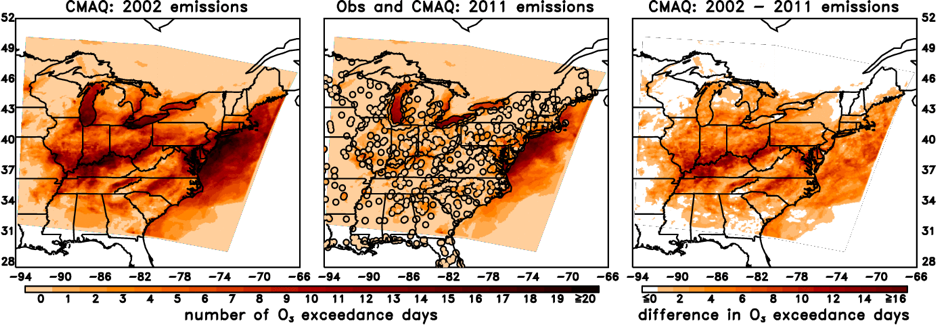
(left) A CMAQ model simulation of the number of O3 exceedences using July 2011 meteorology with 2002 trace gas emissions. An exceedance occurs when the maximum eight hour average O3 standard of 75 ppbv. (middle) The same as the left image, but with 2011 trace gas emissions. Observed O3 values are shown in circles. (right) The difference in the simulated number of O3 exceedence days due to the lower NOx emissions in 2011 versus 2002. Figure adapted from Loughner et al. (2019).
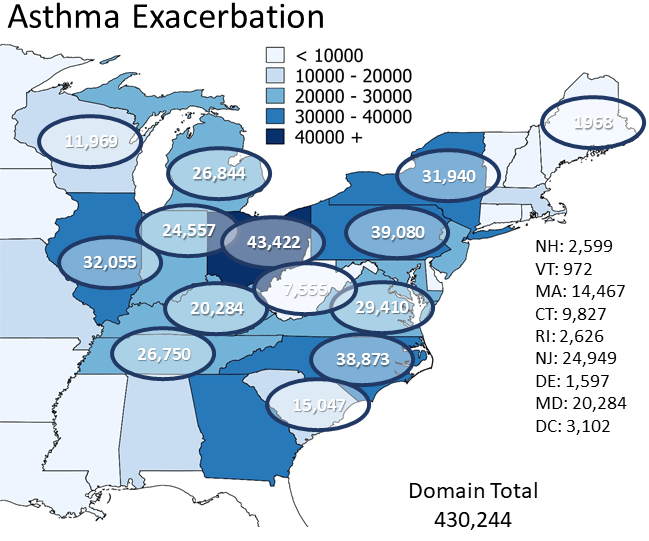
Health benefits of emission reductions for asthma. Figure adapted from Loughner et al. (2019).