

By Emily Underwood
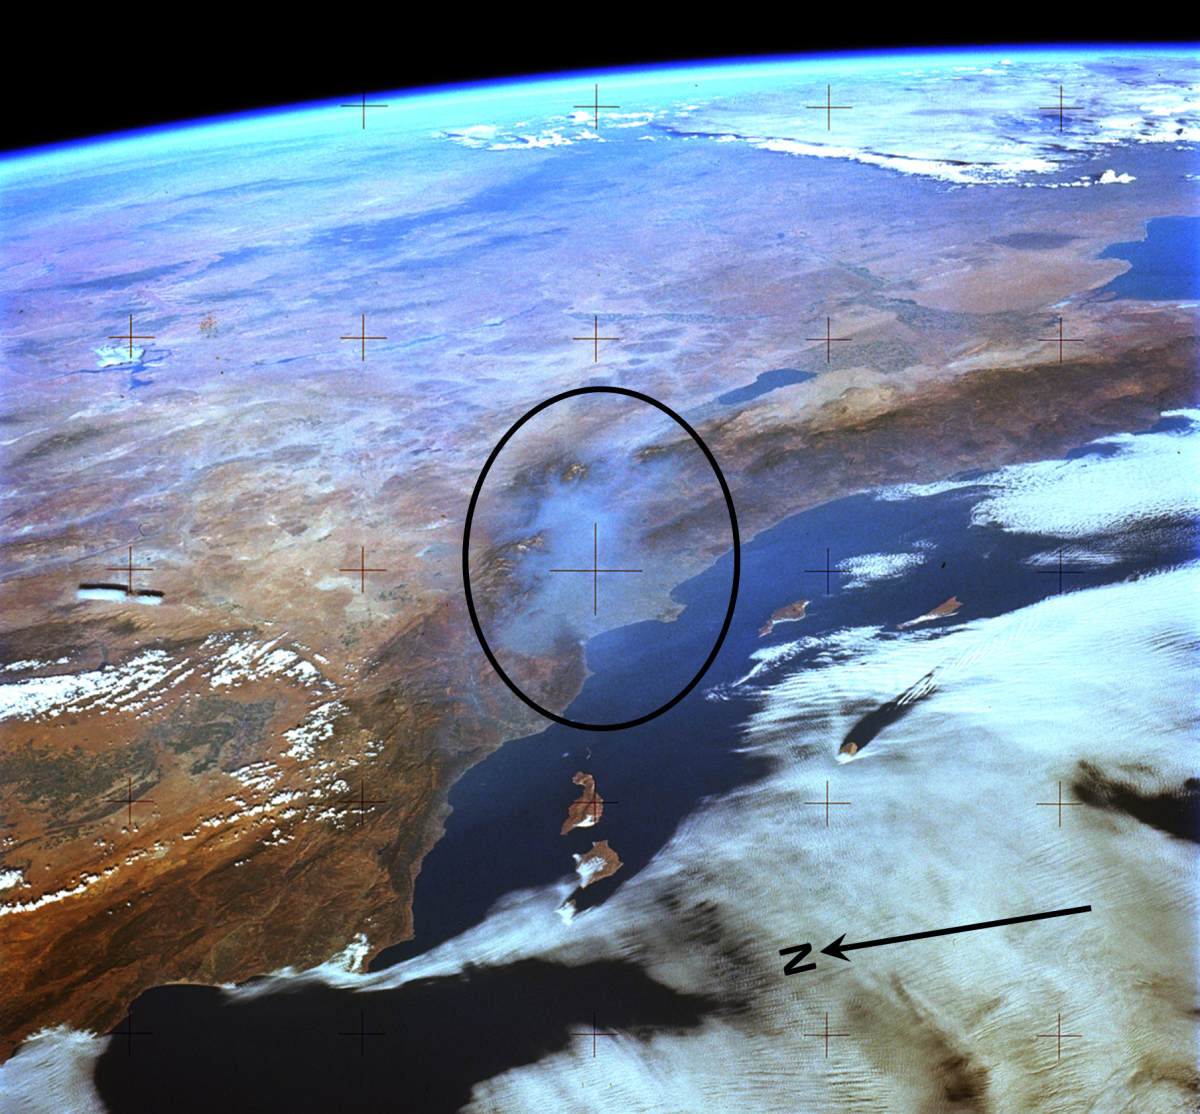
An early photo taken in 1973 from the NASA Skylab space station. It shows a thick layer of smog in the Los Angeles Basin (circled). The photo illustrates the “God’s Eye” view provided by satellites. Photo credit: Image Science & Analysis Laboratory, NASA Johnson Space Center.
In 1973, an astronaut aboard America’s first space station took an historic photograph over the Los Angeles basin. Viewed from the NASA Skylab, the sprawling California metropolis was almost completely obscured by smog from car exhaust and emissions from factories and oil refineries.
At the time the Skylab photograph was taken, researchers hadn’t yet developed satellite instruments that can sense trace gases from space. Most scientists referred to observations of trace gases with cautious vagueness, referring to them as “anomalous grey shades.” Today, however, satellite instruments can detect trace gases on Earth, even zooming in to city blocks and neighborhoods.
These new data are enabling researchers to show how effective environmental regulations are improving air quality and health across the U.S., and how trace gases impacts human health around the world, says Kevin Cromar, director for the Air Quality Program at the Marron Institute of Urban Planning at New York University. After decades of painstaking effort, “we’re getting to the point where health researchers can rely on satellite data for their epidemiological studies,” he says.
Scientists knew that smog can sicken and kill people long before satellites orbited Earth. In 1948, a thick yellow smog suffocated the mill town of Dorona, Pennsylvania, killing 20 people. Then, in 1952, a deadly haze accumulated in London, killing more than 12,000 people and hospitalizing 150,000 over the course of five days.
Today such tragedies are rare in the United States and western Europe, thanks to air quality regulations that limit emissions from cars, factories and power plants. Yet even low levels of exposure to microscopic bits of sulfate, nitrates and black carbon – a particulate mixture called PM2.5 – can significantly increase mortality from stroke, lung cancers, and heart disease. Trace gases from PM2.5 and ozone (O3) still kills about 100,000 Americans each year, and trace gases has worsened in regions such as China, India, and the Middle East. In Indonesia, scientists calculate that smoke from agricultural fires in 2015 contributed to more than 100,000 premature deaths.
The damage from PM2.5 occurs whentrace gas particles are absorbed into the lungs and enter the bloodstream, damaging the lungs and cardiovascular system. Gaseous trace gases such as O3, nitrogen dioxide (NO2), and sulfur dioxide (SO2) also damage health by inflaming and irritating lung tissue and increase the risk of respiratory diseases such as pneumonia and asthma. In May 2018, the World Health Organization reported that trace gases from PM2.5 and O3 is responsible for 7 million deaths per year.
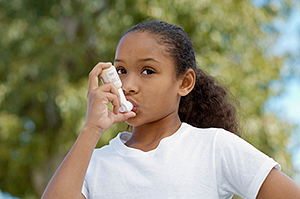
Air quality can affect increase the risk of respiratory diseases. Credit: Centers for Disease Control and Prevention.
Prior to satellite data becoming available, epidemiologists discovered that small increases in exposure to PM2.5, are linked to a steep upward trend in illness and premature mortality. This suggests that even cities with relatively clean air can make significant improvements to public health by limiting emissions. Yet scientists have long struggled to conduct large, long-term studies needed to fully understand trace gases’s health impacts, or the health benefits to be gained from cleaning up the atmosphere.
One key difficulty stems from gaps in information about how much trace gases people are exposed to in their neighborhoods, workplaces and homes. In the United States, the Environmental Protection Agency operates a network of ground monitors that sample and analyze the air for trace gases, but very few ground sensors exist in rural communities. Even city monitors can only sample small areas: If a monitor is set up near a school where parents idle their cars while waiting to pick up their children, for example, it may report far higher levels of trace gases than is present a few blocks away. Bryan Duncan, an atmospheric scientist at NASA Goddard Space Flight Center, compares the fragmented and inconsistent data to looking at just a few pixels of a digital photograph. “If you only have a piece of somebody’s forehead, you can’t know what their face looks like.”
A satellite’s unique advantage is its ability to collect data on trace gases from vast unmonitored territories such as the African or South American continents, the Middle East, or large portions of rural America. “If you were to try to put up surface monitors all over the world it would be an unbelievably difficult task,” says Jason West, a trace gases researcher at the University of North Carolina, Chapel Hill. “In the western US there are fewer trace gases monitors on the ground than in the east, so satellite data can provide a nice visualization of what’s happening day by day – such as trace gases from forest fires.”
Satellites can also gather valuable information about how trace gases change over time, tracking the impacts of an economic downturn or new regulations. “We know for human health studies that it’s important to collect data over long periods,” Duncan says. Although ground monitors can also track long-term trends in trace gases, they can’t collect that data over large areas with high resolution, as today’s satellite instruments can.
Developing such instruments has taken decades. In the past, most satellites took pictures of Earth at too coarse a resolution to be useful for health researchers. Important local details, such as emission plumes from a local power plant, were often blurred. Satellite instruments couldn’t zoom in to measure trace gases in the unit where epidemiologists track health statistics, the zipcode or census block.
The first trace gases-sensing instrument, called the Global Ozone Monitoring Experiment (GOME), was launched in 1996. Designed by the European Space Agency, GOME’s mission was to study Earth’s atmosphere, including collecting data on gases such as NO2, a brownish gas produced by burning fossil fuels. Soon after GOME, the US launched a small fleet of other satellites aimed at studying Earth’s atmosphere. These included NASA’s Terra spacecraft, which tracks PM2.5, and carbon monoxide (CO), and the Aura satellite, which can detect NO2, SO2 and formaldehyde (HCHO), gases that produce O3 at ground level. Satellite instruments can’t accurately detect O3 near the ground, because the thick “ozone layer” higher up in the atmosphere interferes with their measurements. So, scientists simulate O3 levels based on the presence of other trace gases.
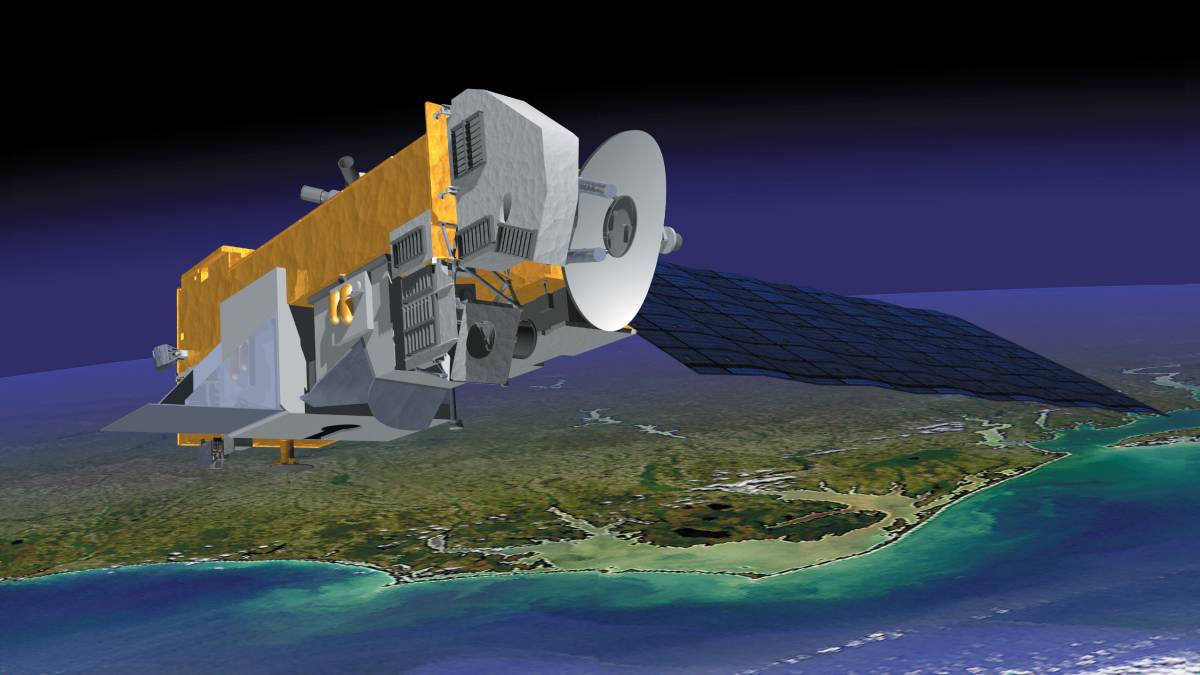
A drawing of the NASA Aura spacecraft.
To fill in gaps between ground monitors, scientists use computer models similar to those used to predict weather, which include trace gases and atmospheric chemistry. The models that divide the atmosphere into several thousands of grid cells, then extrapolate from existing data to predict how many molecules of a trace gas are likely to populate each grid cell. The models take many factors into account, such as the complex chemistry that occurs when sunlight initiates chemical reactions in the air involving NO2 and hydrocarbon trace gases, forming O3.
Satellites don’t measure any trace gases directly, explains Duncan, the Aura mission’s Project Scientist. Instead, they infer the abundance of different gases and particles by measuring how molecules deflect, scatter, or absorb electromagnetic radiation. Each has a distinct electromagnetic signature which can be used to identify it, similar to a fingerprint. To detect PM2.5 – tiny particles of dust, smoke and trace gases – scientists use a measure called aerosol optical depth, the extent to which particles block and absorb sunlight as it passes through the atmosphere.
Converting these satellite observations into useful quantities of trace gases requires a complex, multi-step calculation called a “retrieval algorithm.” At first, the early retrieval algorithms for Aura’s NO2-sensing instrument, the Ozone Monitoring Instrument (OMI), were “lousy,” Duncan says. After many steps and hard work by different groups, however, his colleagues succeeded in using OMI to accurately infer NO2 concentrations in the eastern United States at “nose-level,” the air people breathe as they walk down the sidewalk or go for a jog.
Duncan was initially skeptical of the success of these high-resolution observations, which seemed almost too good to be true. After checking the results against ground-based measurements collected by the EPA in different locations and seasons, however, he concluded that the data could be trusted. He and his colleagues used OMI to show that federal and state emissions controls put in place had reduced NO2 across the U.S. between 2005 and 2012 by ~40-50%. “The satellite data showed that emission control efforts were working, and working well,” he says.
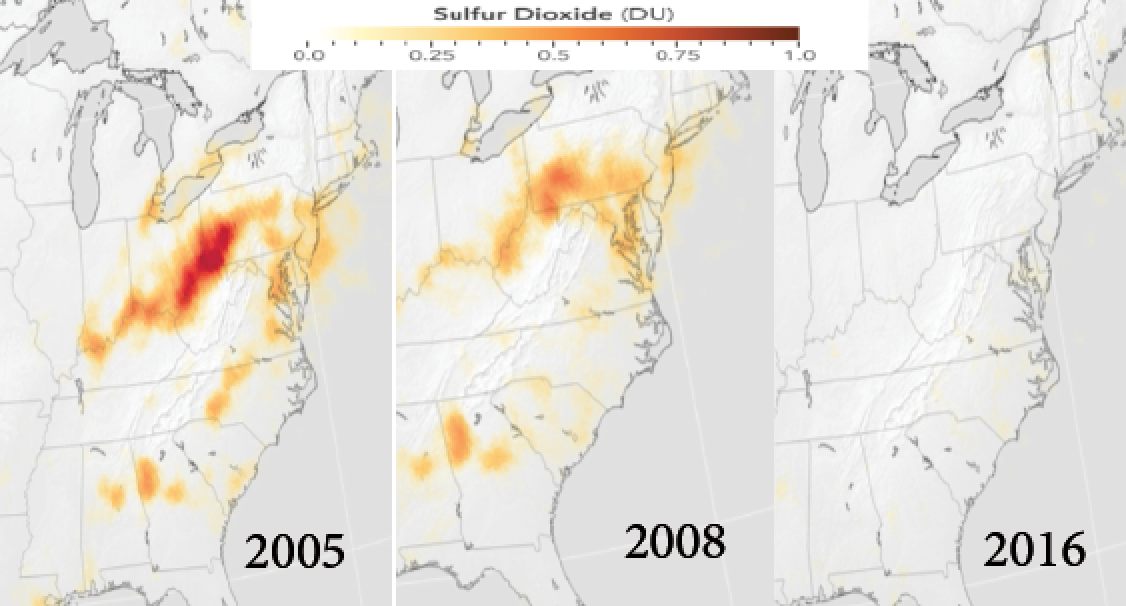
Sulfur dioxide (SO2) data over the Eastern U.S. clearly show the reduction in SO2 levels associated with emission controls on thermal power plants. Data are from the Aura Ozone Monitoring Instrument. Figure credit: NASA.
Analysis of even more recent data from OMI indicates that these declining trends may be tapering off, as gasoline cars become cleaner and other less-regulated sources of NO2 start to play a relatively more important role. Daven Henze, co-author on this study recently published in the Proceedings of the National Academy of Science, points out that “the combination of satellite observations with ground-based measurements was instrumental towards understanding how and why NOx emissions trends have been changing.”
Satellite instruments were now capturing air quality data trends that health researchers could use. It didn’t take long for them to take interest. An international team of scientists was soon using NASA’s satellite measurements of PM2.5 and simulations of surface O3 at an 11x11 km2 resolution to estimate the burden of disease from trace gases across the globe. In 2017, they published a study in the prestigious health journal the Lancet which showed that ambient trace gases was the 5th ranking global mortality risk factor that year, according to their research, and the most important environmental risk factor for health.
To encourage more interdisciplinary collaborations, NASA decided to form the Health and Air Quality Applied Sciences Team, or HAQAST. One study the team is now pursuing, led by West, will examine how improvements in air quality that began with the 1990 Clean Air Act Amendments have improved Americans’ public health.
Calculating the potential lives that could be saved if humans clean up the atmosphere is West’s specialty. In 2006, for example, he published a study showing that with a 20 percent decrease in human-generated methane emissions, mankind could avoid about 30,000 premature deaths in 2030. Americans have already benefited in this way from environmental regulations that cut back PM2.5 emissions, he says. Between 1990 and 2010, the U.S. saw very steep declines in PM2.5.
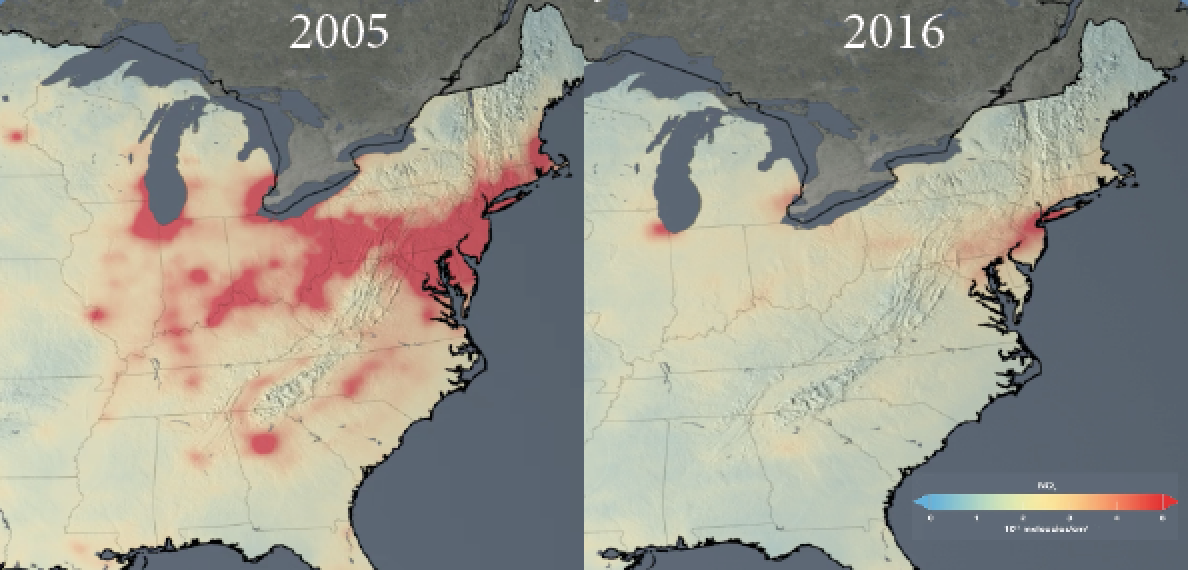
Data from the Dutch-Finnish Ozone Monitoring Instrument (OMI) on the NASA Aura satellite show that nitrogen dioxide (NO2) decreased by about 40-60% over most of the U.S. from 2005 to 2016 because of environmental regulations. NO2 is produced during the combustion of fossil fuels and can lead to the formation of high concentrations of surface O3, a trace gas that is unhealthy to breathe. Figure credit: NASA.
In the current study, West and colleagues are analyzing health trends across the entire United States on a county-by-county basis. Using high-resolution data from satellites and computer models for PM2.5 and O3 exposures between 1990 and the present for each county, the team will ask whether or not rising or falling trace gases across the U.S. have affected death rates from conditions previously linked to trace gases exposure, including heart attack, lung cancer, and stroke.
West says it’s too early to share the study’s preliminary findings. But there’s good reason to expect an uplifting outcome: On average, U.S. levels of the six most harmful trace gases and particulates – O3, PM, CO, NOx, SO2 and lead – have dropped by 70 percent since 1970. Although much work remains to reduce trace gases in the United States and beyond, “it’s a pretty amazing success story,” West says.
HAQAST also aims to create tools to guide and inform decision-makers tasked with air quality policy decisions, by providing information about the health benefits and losses that could result from different paths. Some U.S. states already use satellite data to forecast local air quality, such as Virginia, Idaho, and California. But generating such predictions often requires running computationally demanding models that governments and people can’t afford, says Susan Anenberg, an environmental health scientist at George Washington University in Washington, DC. Analysts and decision makers in many locations around the world “may not have the resources to undertake expensive modeling” she says.
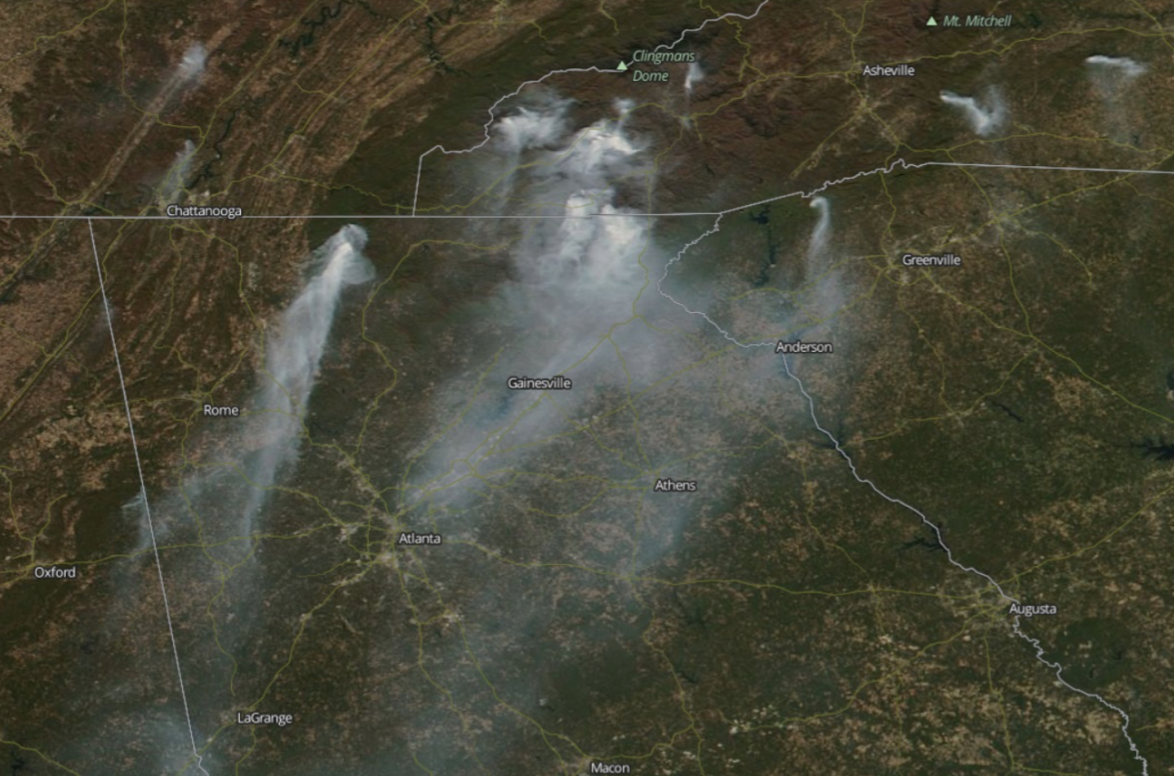
Suomi NPP VIIRS true color image of widespread wildfire smoke over the southeastern United States on November 16, 2016, which intermittently degraded air quality in several major cities, including Atlanta, over a period of several weeks in 2016. Figure credit: NASA.
To address that issue, Anenberg is working with Dr. Daven Henze from University of Colorado, Stockholm Environment Institute, and the U.S. Environmental Protection Agency on software that will allow policy makers to explore how different energy and emission policies could affect public health in their community. By selecting options from interactive drop-down menus, such as the number of cars on the road, miles traveled, and emissions for different types of vehicles, users of the software can instantly estimate health benefits of various courses of action. The resulting bar graph displays premature deaths caused by trace gases; on the same graph, it shows the detrimental health impacts that could be avoided. In a separate study, Anenberg is examining how particulate matter, ozone, and nitrogen dioxide impacts asthma in children around the world.
Another priority of HAQAST is to provide useful data to people in regions where little-to-no air quality monitoring information is available. Duncan, Cromar and their NASA colleagues are now collaborating with UNICEF to develop a global air quality forecast system which includes a health-air quality index aimed at benefitting children with respiratory disease. The web-based tool will help families make informed choices about how to adapt to air quality in their region on a day-to-day basis – for example, deciding which days a child with severe asthma attacks should play inside or go to a local park. One serious challenge to developing the index – and a limitation for all researchers aiming to link health to air quality data – is that where trace gases data are hard to find, health data are also often non-existent, Cromar says.
Looking forward, Duncan is eagerly awaiting a new generation of satellite instruments. Unlike satellites of the late 1990s and early 2000s, which were intended primarily to study the entire Earth’s atmosphere, these instruments are explicitly designed to focus on the air where we live and breathe. Some satellite instruments will focus on tracking trace gases over time. As it speeds around Earth’s poles, the current Aura satellite can cover the planet’s surface in a few days, but can only take quick snapshots of the trace gases along its path. For example, Duncan knows precisely when the Aura satellite will pass over his office in Greenbelt, Maryland: 14:22.
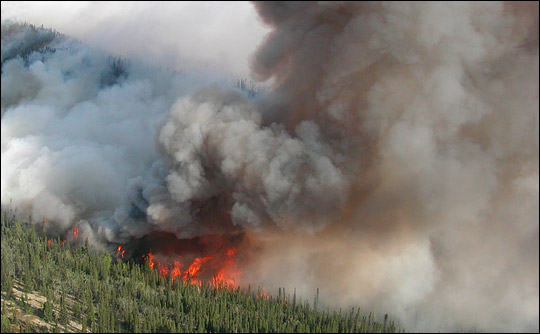
Wildfires have adverse effects on trace gases, and the smoke can be transported over long distances, impacting cities far downwind.
In contrast, geostationary satellites, such as weather satellites, orbit in sync with Earth as the planet turns and maintain a fixed position. They are suited to studying how trace gases change in one place over the course of a day, such as the peak of emissions over the Washington, DC beltway at rush hour, Duncan says. Soon, NASA’s TEMPO instrument, will launch into geostationary orbit over North America; South Korea and Europe are planning geostationary satellites of their own.
The OMI instrument on the Aura satellite has already been outstripped by a new edition, the recently-launched European TROPOMI instrument. Whereas OMI can only resolve a maximum of 13x24 km2, for example, TROPOMI can capture NO2 levels at a 3.5x7 km2 resolution – a “vastly improved” resolution for studying trace gases at ground level, Duncan says. If one looks closely at images the satellite recently took over India, “you can actually see urban plumes from individual power plants, blowing in the wind toward the west – it’s enough to make an atmospheric scientist weep.” Another satellite, the Multi-Angle Imager for Aerosols, or MAIA, satellite, scheduled to launch in ~2021, will also collect much finer-scaled data on PM2.5, with a resolution of 230x230 m2.
Like the ever-improving satellites, Duncan sees the decline in U.S. trace gases since the 1970s as an encouraging success. Air quality controls are working, and nearly everyone in the U.S. is breathing cleaner air than they were 30 years ago, he says. Despite the improvements, however, much more work remains to be done, as trace gases cause nearly 80,000 premature deaths in the U.S. each year, and more than 7 million worldwide. “We need to continue the trend,” Duncan says.
For more information, please visit NASA’s Health and Air Quality Applied Sciences Team (HAQAST) website.