
Smog in Shanghai, China

News

florida2015-2019 florida2020

Pandemic Before and After: Florida 2015-2019 versus 2020

Figure caption: Over the past several weeks, Florida has seen significant reductions in air pollution over many of its major metropolitan areas, such as Miami and Orlando. Similar reductions in air pollution have been observed across the globe.

Airborne Particle Levels Plummet in Northern India

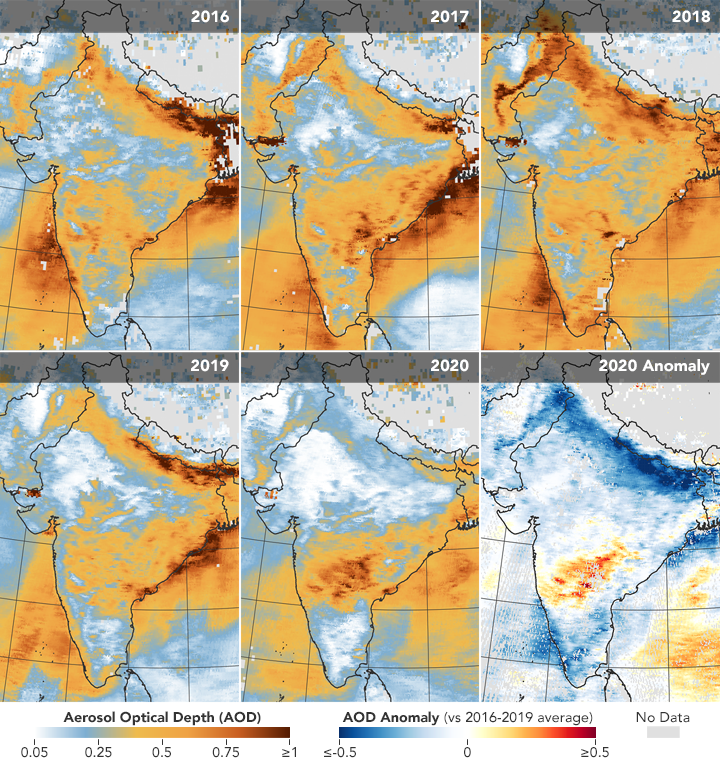
On March 25, 2020, the Indian government placed its 1.3 billion citizens under a strict lockdown to reduce the spread of the COVID-19 coronavirus. The country-wide mandate decreased activity at factories and severely reduced car, bus, truck, and airplane traffic. After just a week of reduced human activities, NASA satellite sensors observed aerosol levels at a 20-year low for this time of year in northern India.

Video: Northeast US 2015-2019 versus 2020

Over the past several weeks, the Northeast U.S. has seen significant reductions in air pollution over many of its major metropolitan areas, such as New York City and Baltimore. Similar reductions in air pollution have been observed across the globe. These recent improvements in air quality have come at a high cost, as communities grapple with the widespread stay-at-home advisories that began about a month ago as a result of the spread of COVID-19. The animation shows satellite data of NO2 from the Aura Ozone Monitoring Instrument (OMI) over the Northeast United States in March for each year from 2015 to 2020. Year-to-year variations in weather and pollutant emissions cause variations in the monthly means for individual years. March 2020 shows the lowest values as compared to any of the monthly values for March during the OMI data record, which spans 2005 to present. Caution: Further analysis is required to rigorously quantify the amount of the change in NO2 levels associated with changes in pollutant emissions versus natural variations in weather.

2015-2019 Average NO2 for the Northeast US 2020 NO2 Map for the Northeast US

Pandemic Before and After: Northeast US 2015-2019 versus 2020

The slider shows satellite data of NO2 from the Aura Ozone Monitoring Instrument (OMI) over the Northeast United States in March. The image on the left shows the mean of the period from 2015 through 2019, while the image on the right shows the mean for 2020. Though variations in weather from year to year cause variations in the monthly means for individual years, March 2020 shows the lowest values a compared to any of the monthly values for March during the OMI data record.

Coronavirus lockdown leading to drop in pollution across Europe

New data, based on observations from the Copernicus Sentinel-5P satellite, are showing strong reductions in nitrogen dioxide concentrations over several major cities across Europe – including Paris, Madrid and Rome.