Due to the lapse in federal government funding, NASA is not updating this website. We sincerely regret this inconvenience.


United States
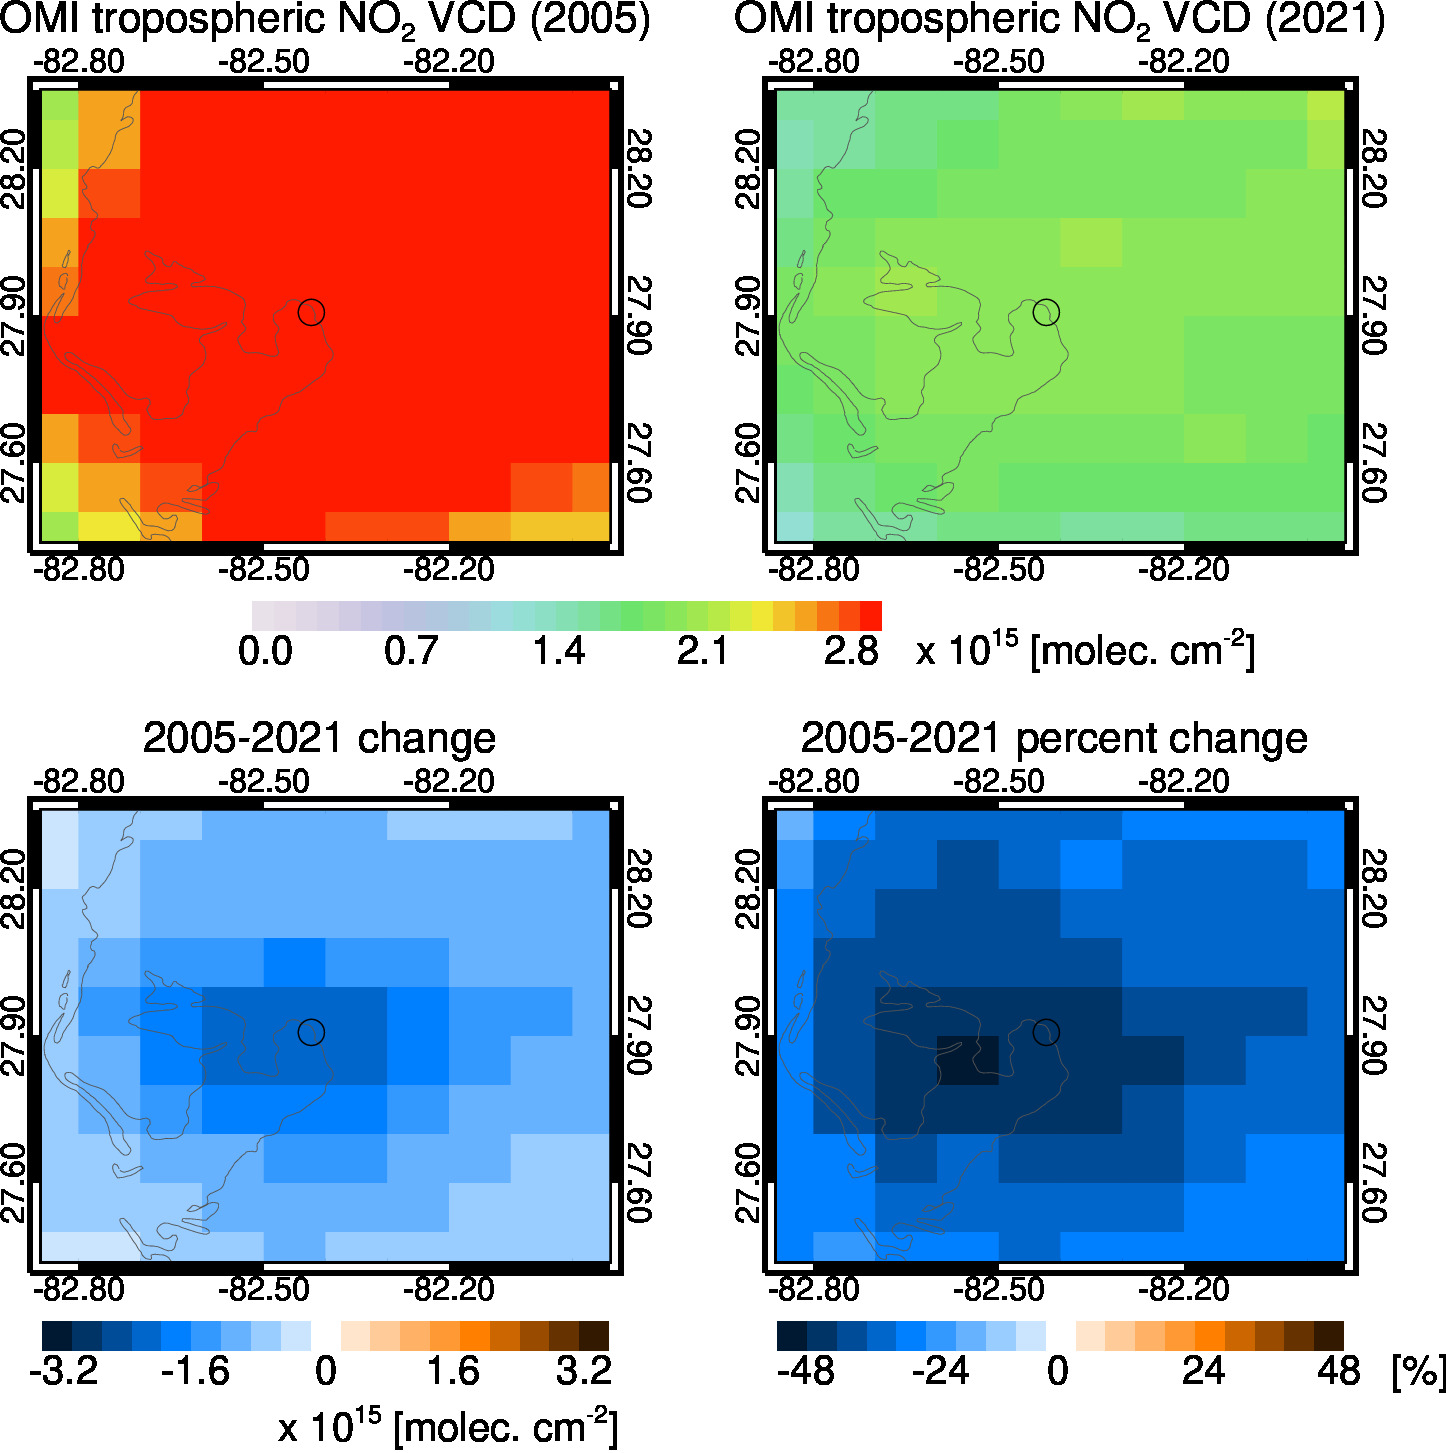
H L Culbreath Bayside Power Station OMI data between 2005-2021.
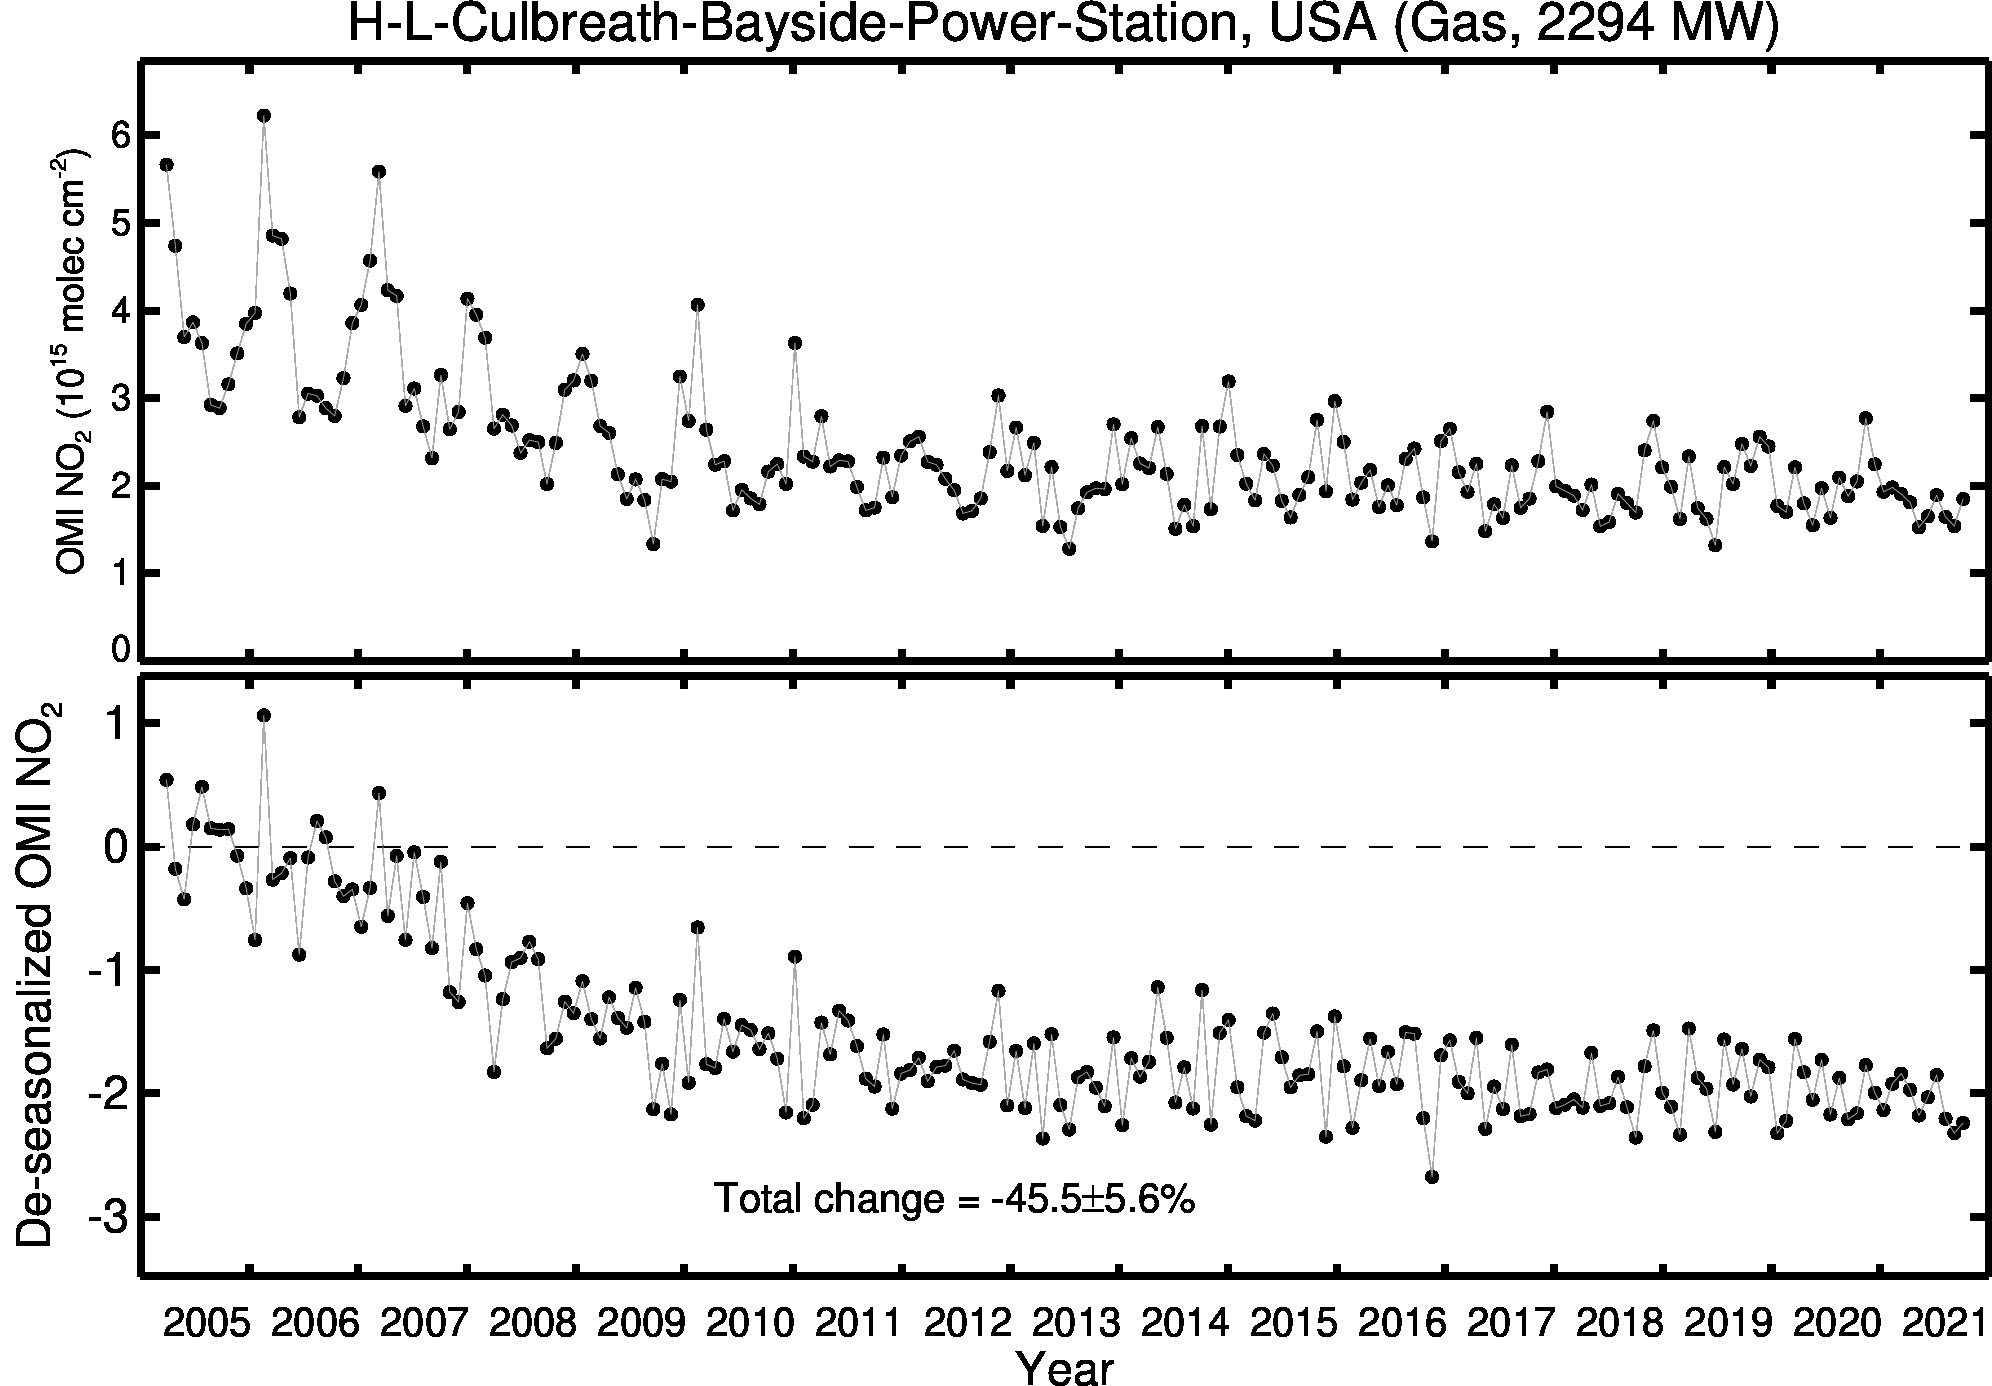
H L Culbreath Bayside Power Station OMI data between 2005-2021.
Find data and information the top global power plants. In the US, the correspondence is generally great between variations and trends in OMI NO2 levels and power plant NOx emissions reported to the Continuous Monitoring Emissions System (CEMS). However, there are many factors that can influence NO2 levels above a power plant, including changes in regional background levels, other nearby sources, etc. See Duncan et al. (2013) for a detailed discussion on this topic.