

Plutarco Elías Calles
Country:
Mexico
Year:
2021
Average NO2:
7.938e+14
Uncertainty (±%):
8.66
Image
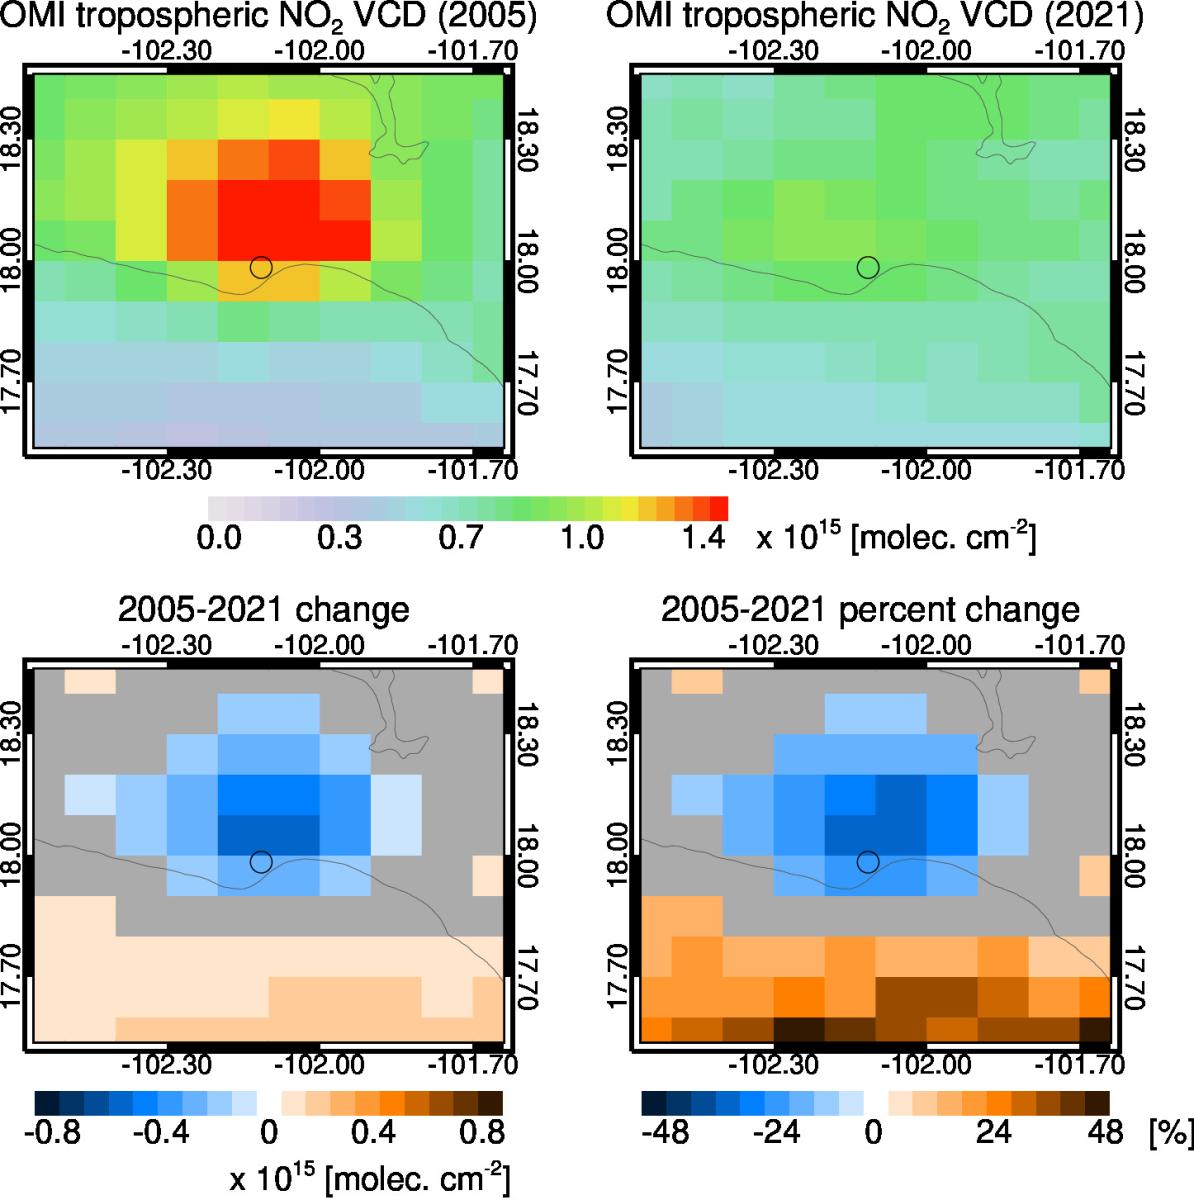
Plutarco Elías Calles Power Plant Trend 2005-2021
Plutarco Elías Calles OMI data between 2005-2021.
Image
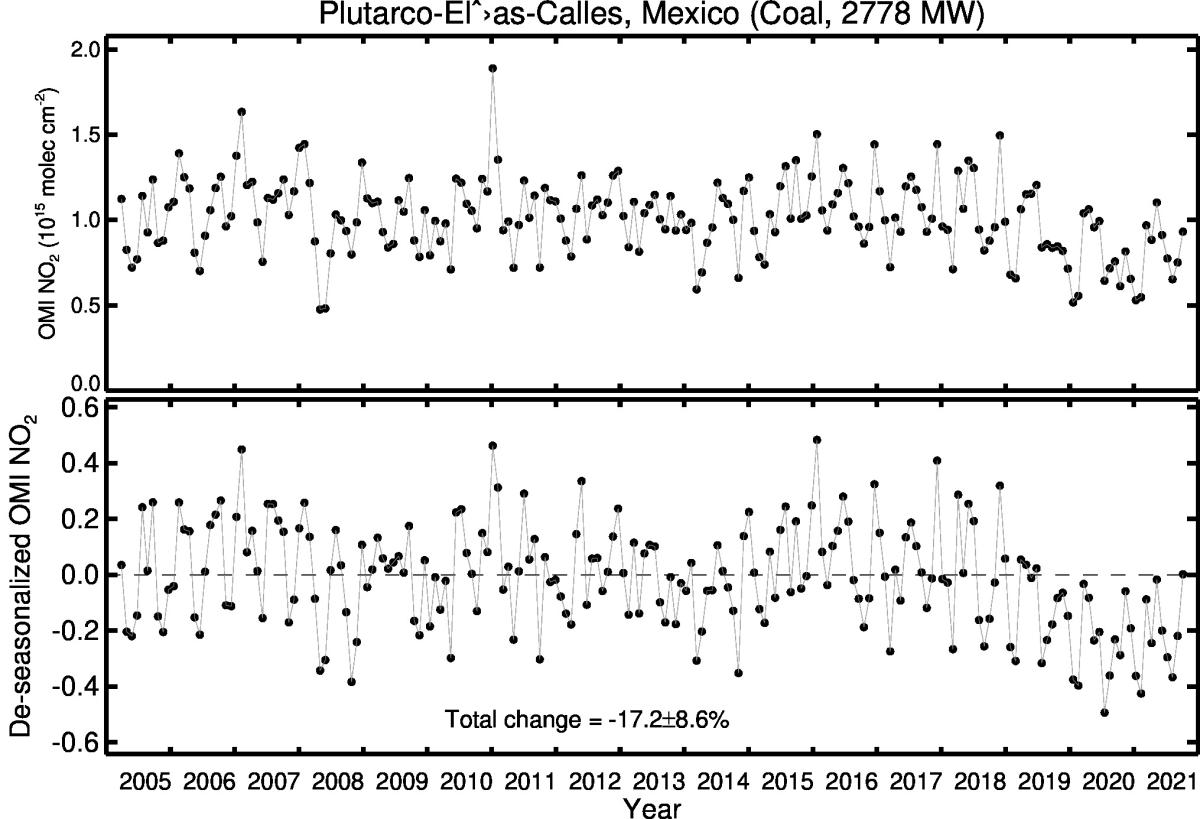
Plutarco Elías Calles Line Plot 2005-2021
Plutarco Elías Calles OMI data between 2005-2021.
Find data and information the top global power plants. In the US, the correspondence is generally great between variations and trends in OMI NO2 levels and power plant NOx emissions reported to the Continuous Monitoring Emissions System (CEMS). However, there are many factors that can influence NO2 levels above a power plant, including changes in regional background levels, other nearby sources, etc. See Duncan et al. (2013) for a detailed discussion on this topic.