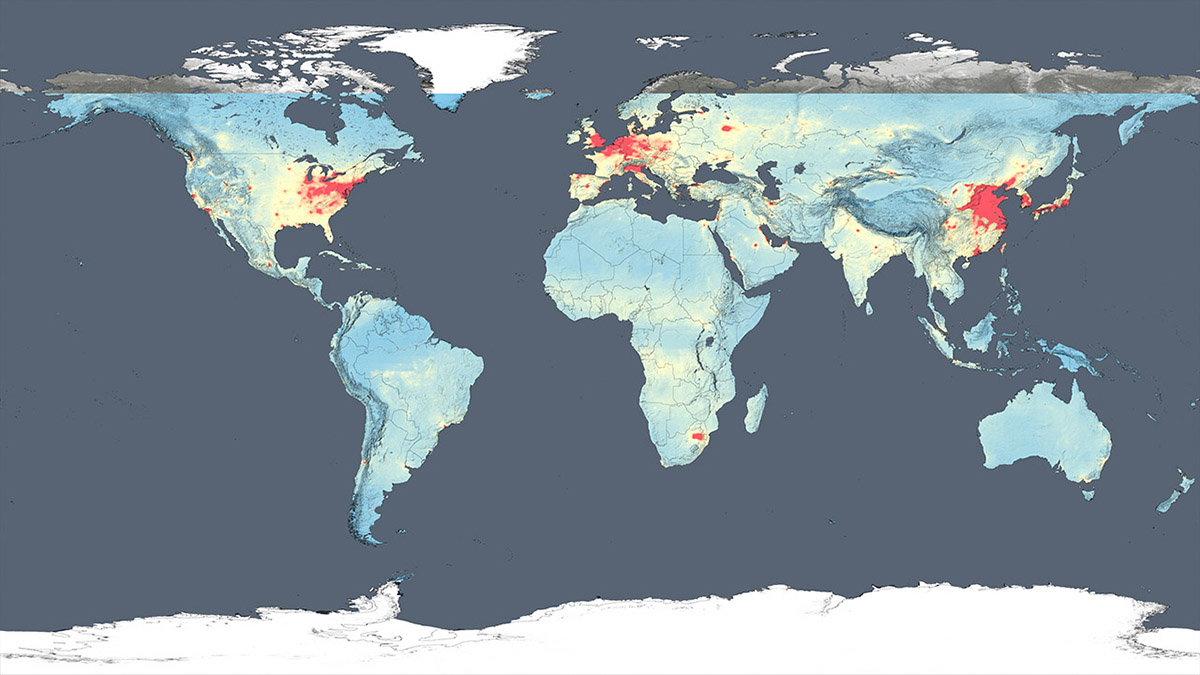
NASA's Goddard Space Flight Center
These global maps show NO2 levels in the atmosphere as detected by the Ozone Monitoring Instrument aboard the Aura satellite, averaged over 2005 and 2014, respectively.


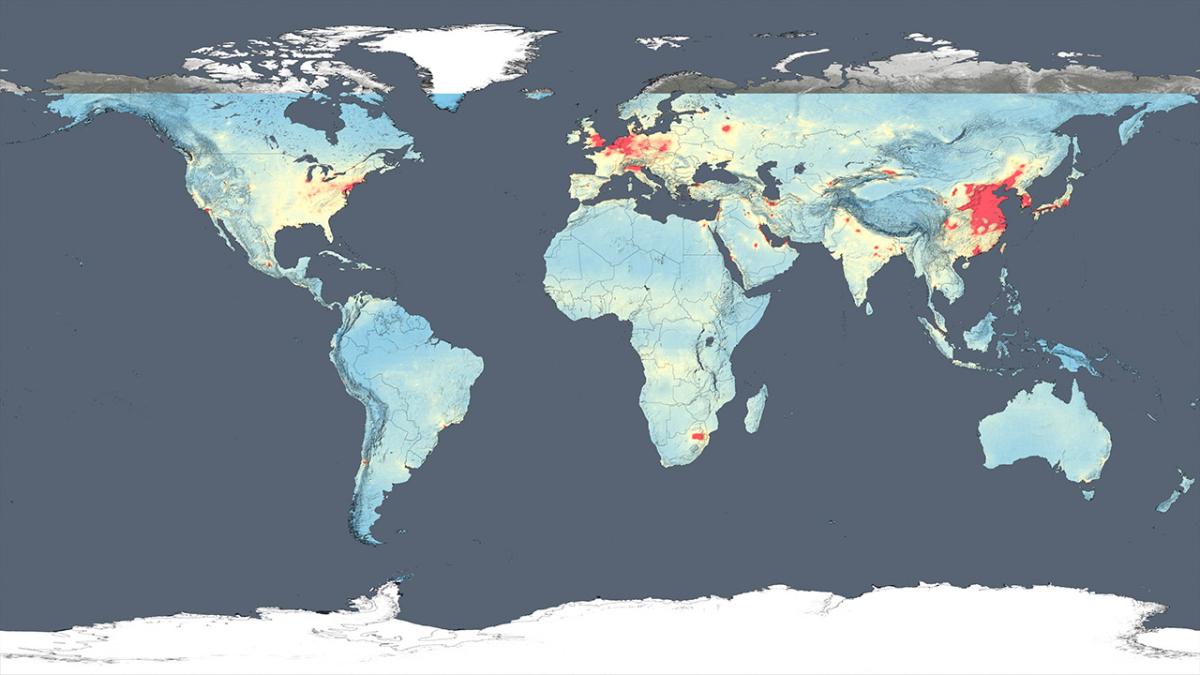
NASA's Goddard Space Flight Center
These global maps show NO2 levels in the atmosphere as detected by the Ozone Monitoring Instrument aboard the Aura satellite, averaged over 2005 and 2014, respectively.