

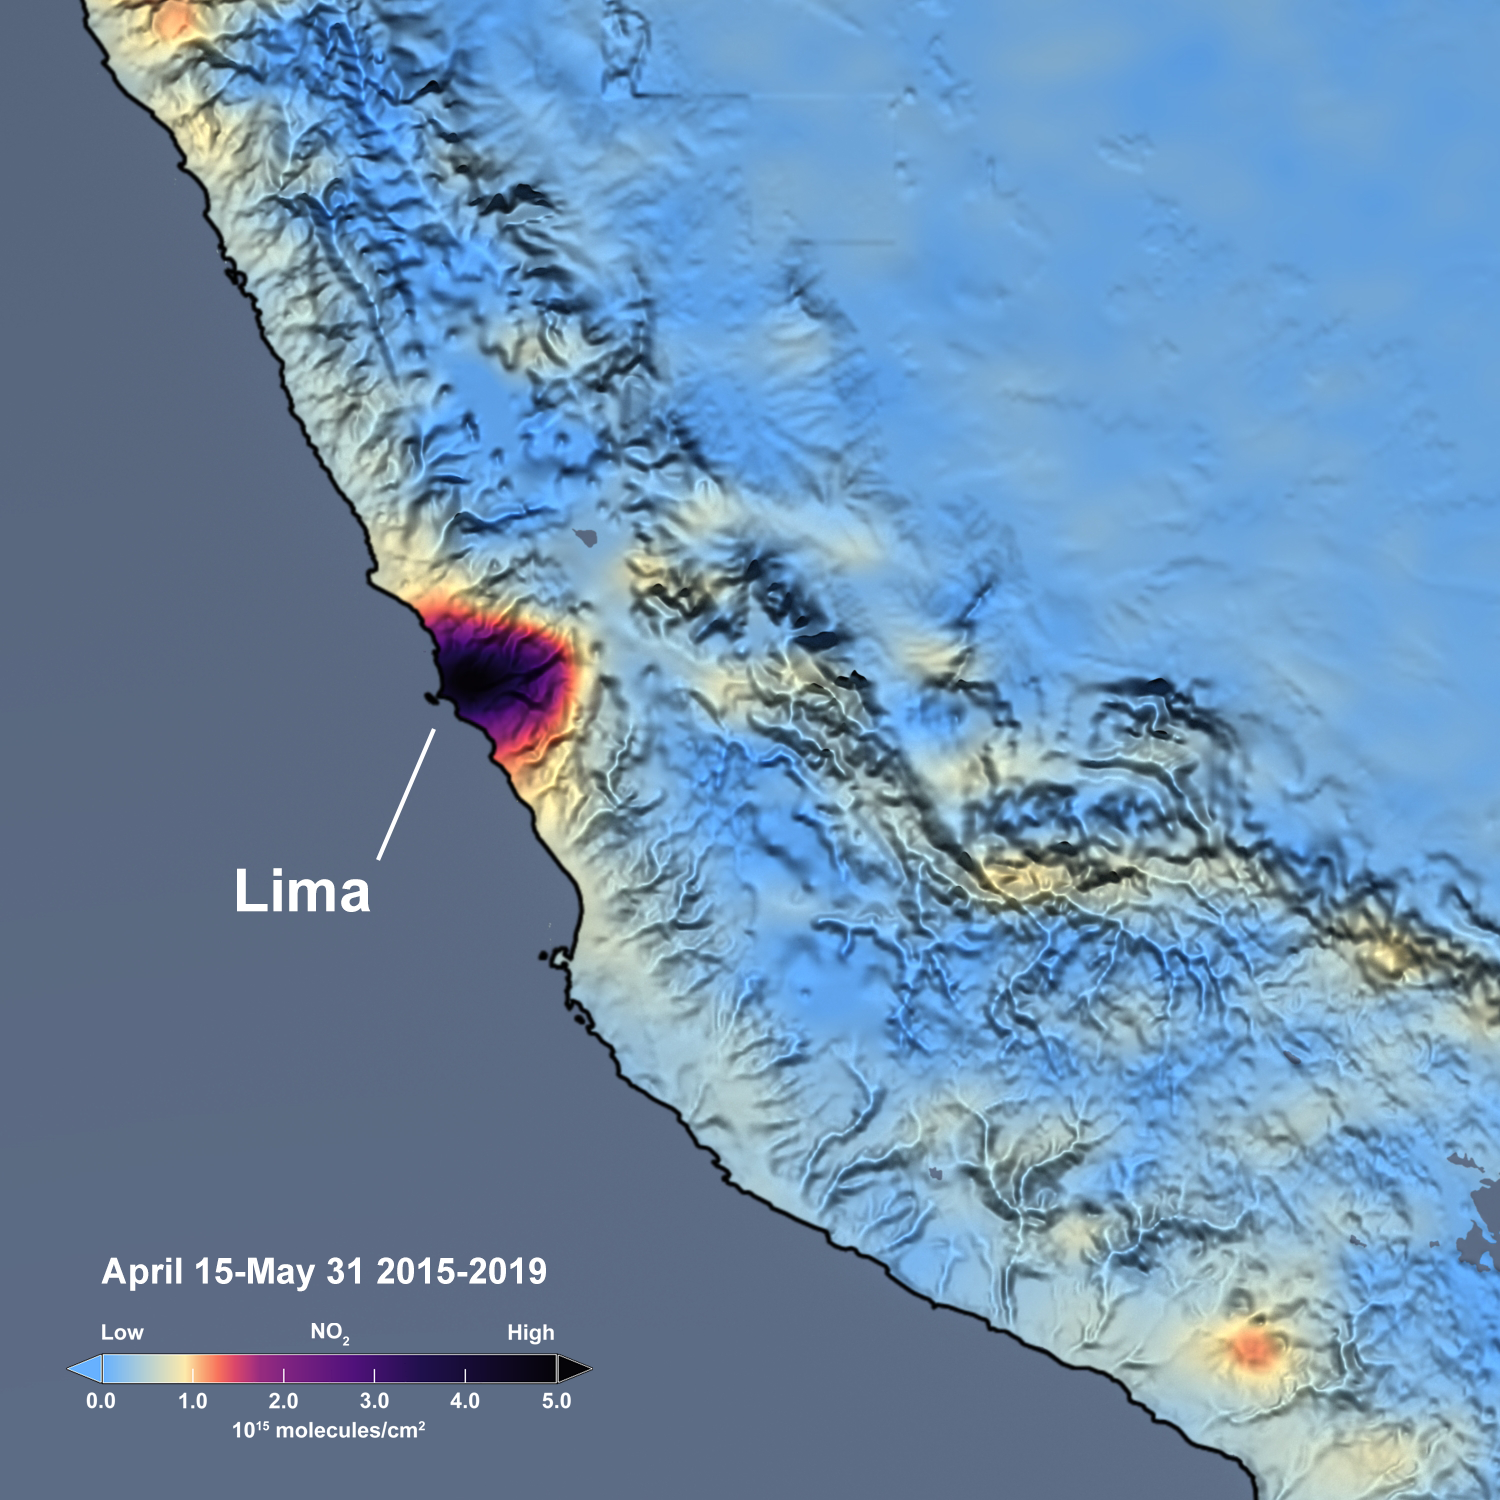
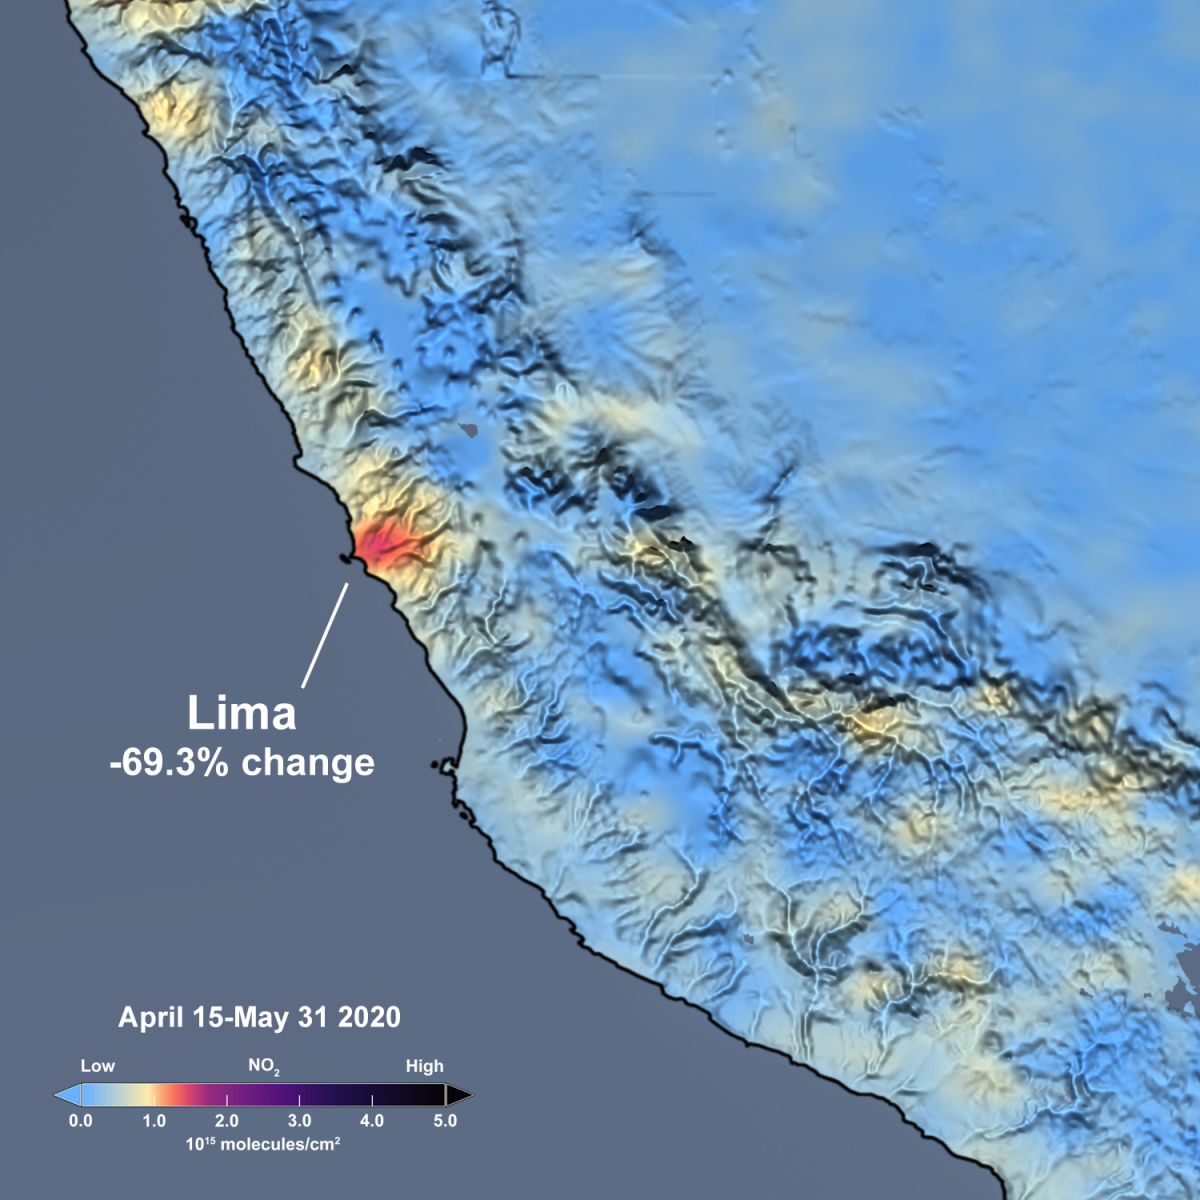
The slider above shows satellite estimates of NO2 from Aura’s Ozone Monitoring Instrument (OMI) as an average of April 15 through May 31. The image on the left shows the mean of the 230-day period from 2015 through 2019, while the image on the right shows the mean of the 46-day period for 2020.