

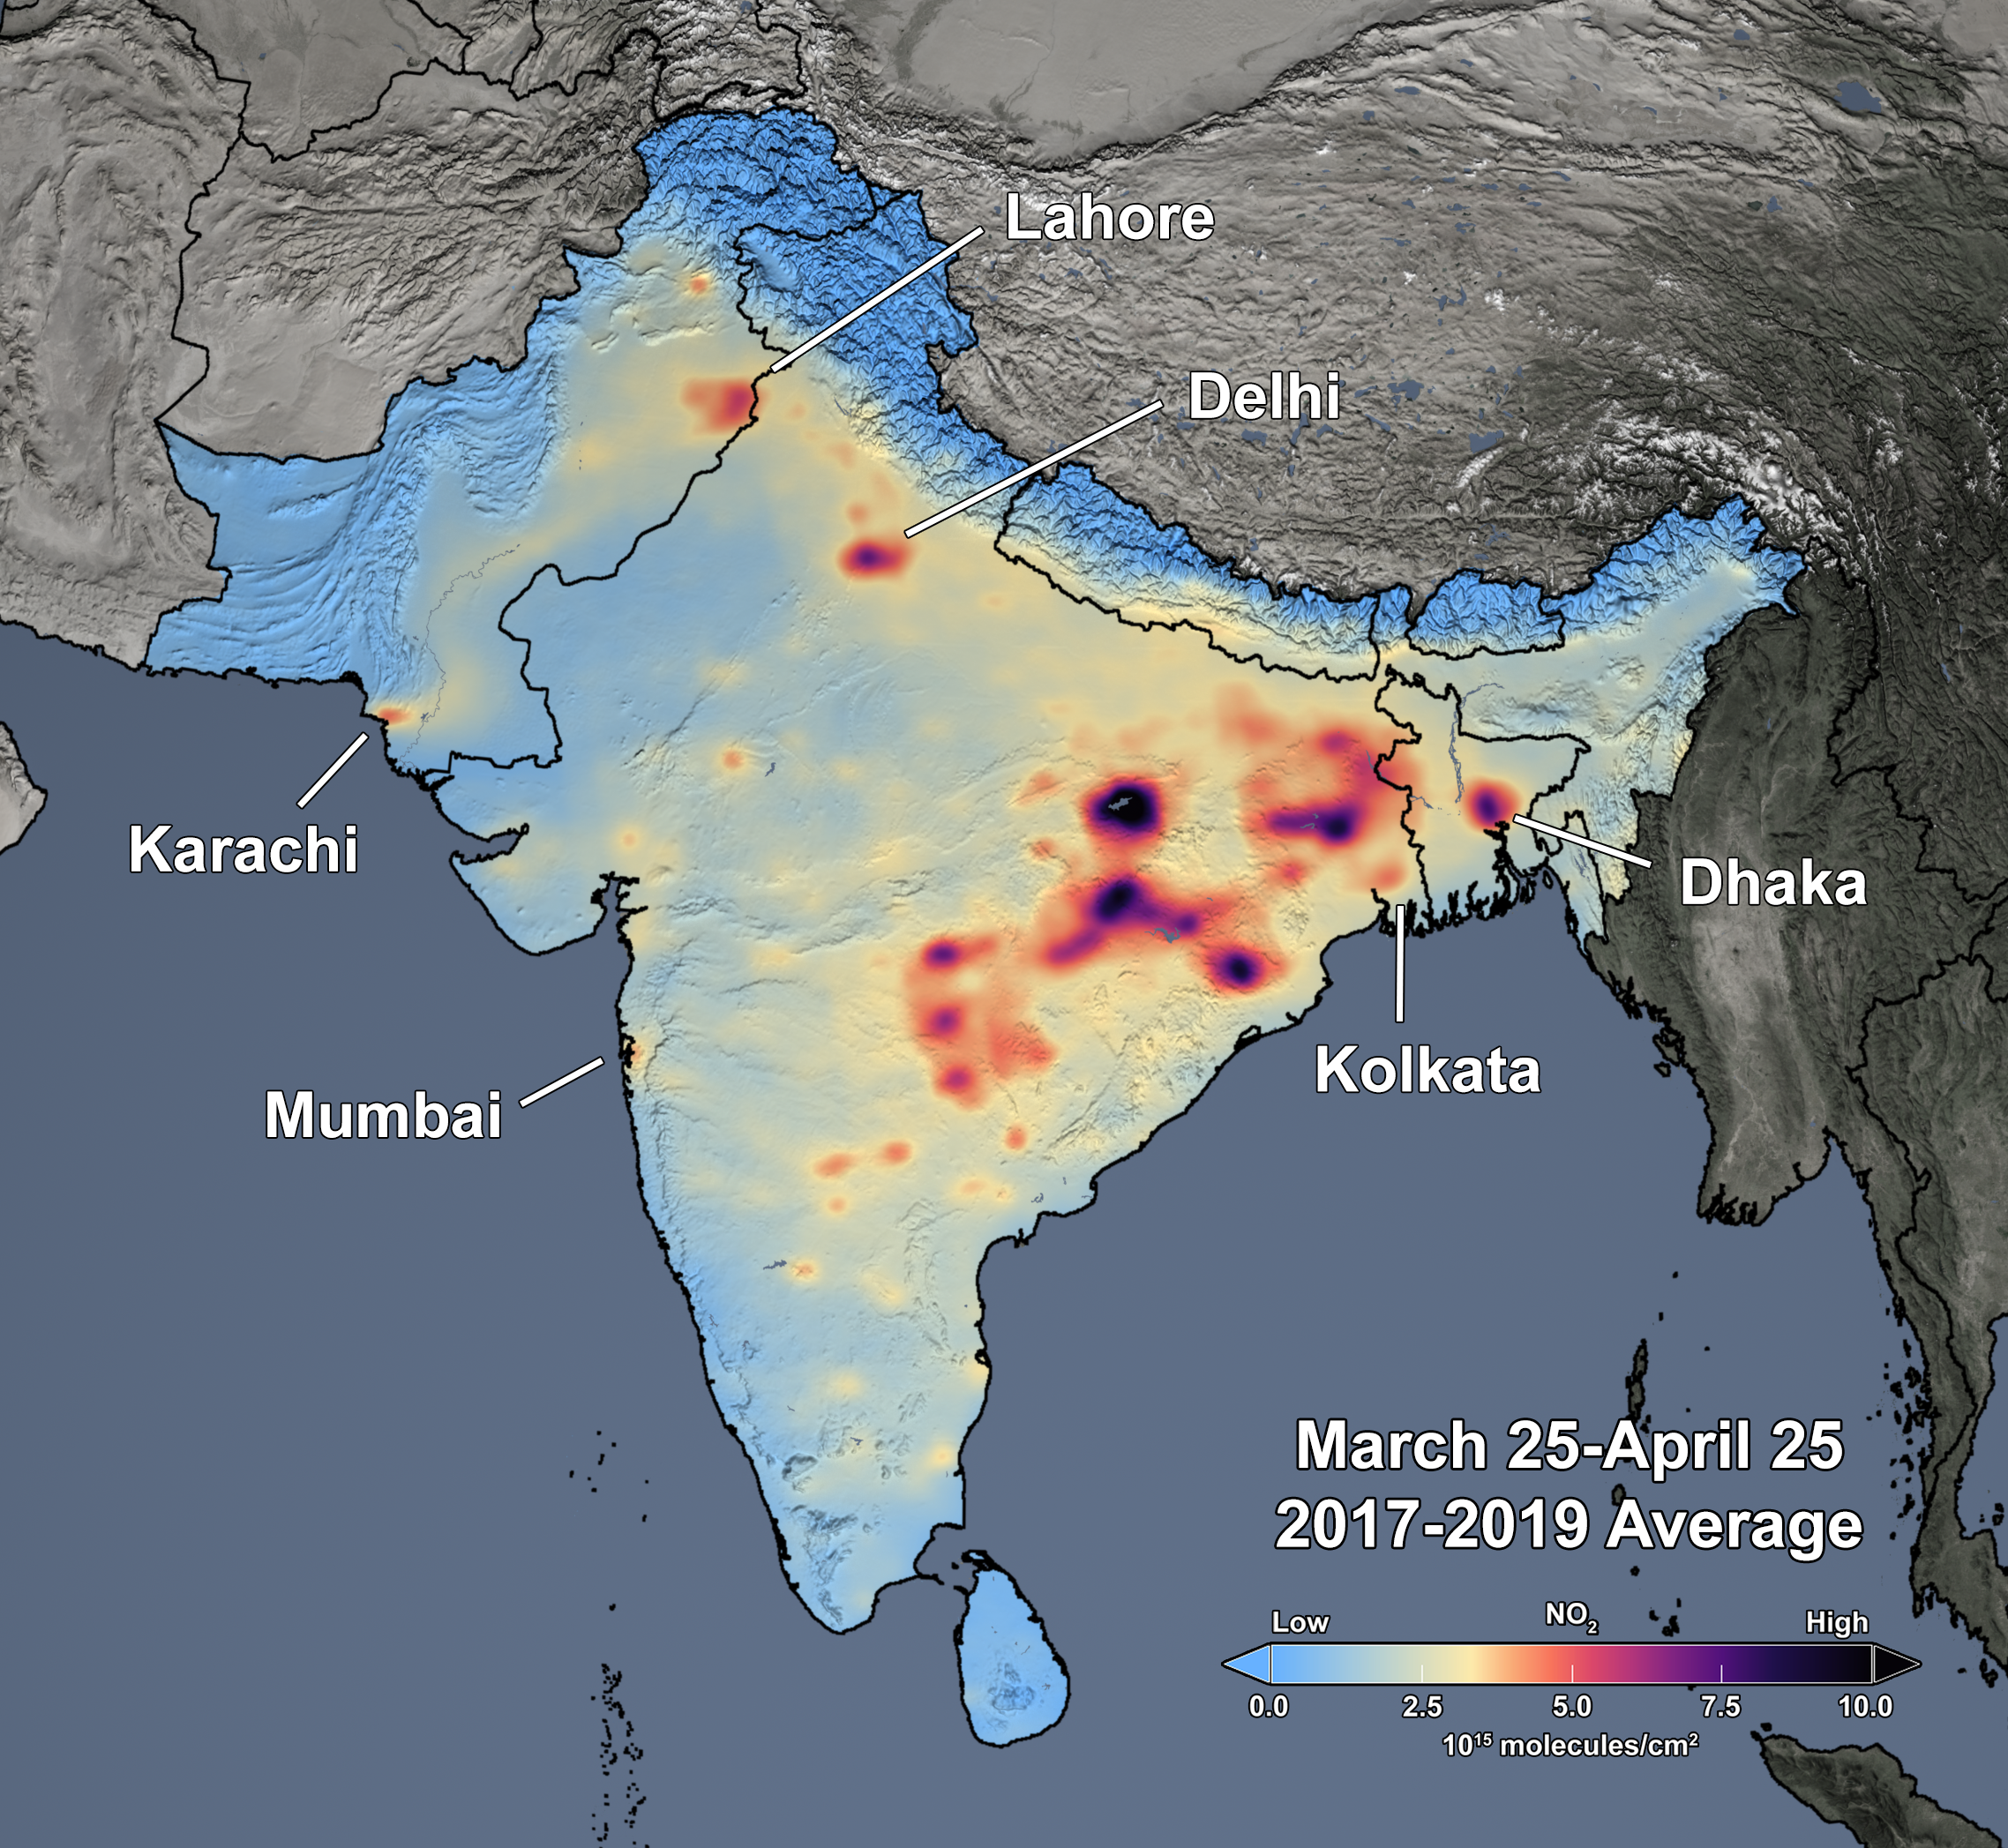
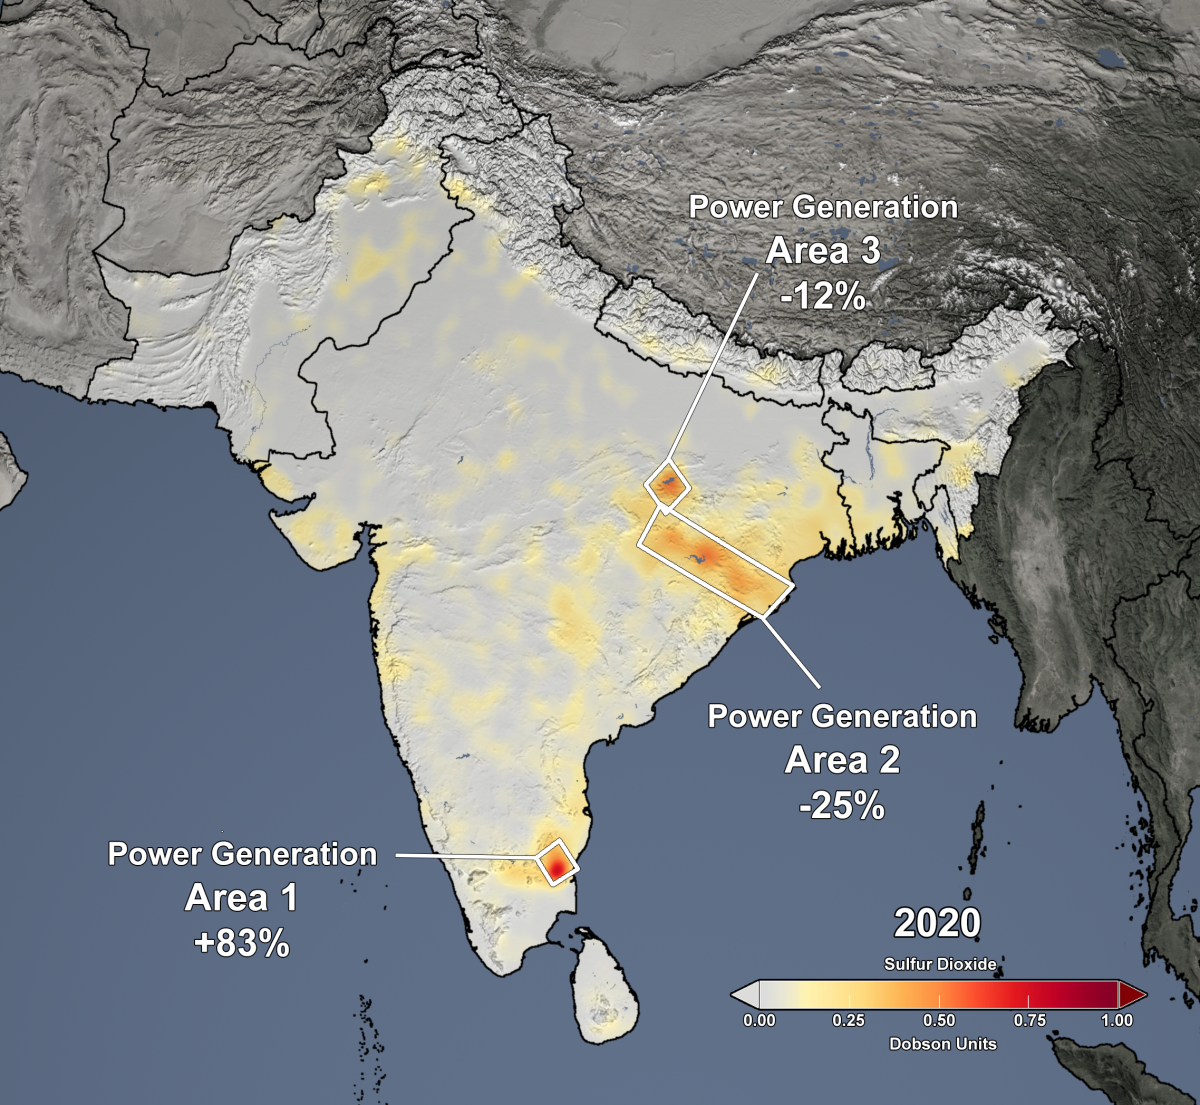
Figure caption: On March 24, 2020, Prime Minister Modi ordered a nationwide stay-at-home order for India’s 1.3 billion citizens in an attempt to slow the spread of COVID-19. As a consequence, less fossil fuels are being consumed and, subsequently, less trace gases is being emitted in India and also in neighboring countries, including Pakistan, Nepal, Bangladesh, and Sri Lanka. The slider above shows satellite data of NO2 from the Aura Ozone Monitoring Instrument (OMI) as an average of March 25 through April 25. The image on the left shows the mean of the period from 2017 through 2019, while the image on the right shows the mean for 2020. The slider shows that widespread decreases (~30-60%) in NO2 levels have occurred over most of South Asia. For instance NO2 levels decreased by about 45% in Lahore, Pakistan, 45% in Dhaka, and 55% in Delhi, India. The highest NO2 levels that remain in South Asia are located in eastern India and are primarily associated with electricity generation by thermal power plants. The images are free and publicly-available and may be downloaded.