

Supporting the Use of Satellite Data in Regional Haze Planning
This HAQAST Tiger Team proposes to work with stakeholders to address three applications of satellite data of direct relevance to regional haze State Implementation Plans (SIPs). The team will develop technical guidance documents that describe their approaches to using satellite data for regional haze applications. We anticipate that the guidance developed under this project will also be relevant to health agencies seeking to assess health burdens due to natural events (e.g., dust, wildfires) associated with severe health effects. In addition, they’ll aid air quality managers in the use of satellite data in the Regional Haze SIP process, provide tangible examples of the value of satellite data for addressing air quality and related health applications, to aid stakeholders who wish to conduct their own analyses, and lower the barrier for new health and air quality stakeholder agencies to apply satellite data.
Other related projects:
Publicly available NASA satellite data can help with NAAQS State Implementation Plans (SIPs)
Efficacy of Environmental Regulations to Improve Air Quality in the U.S.
Deliverables
PM & Precursors
United States
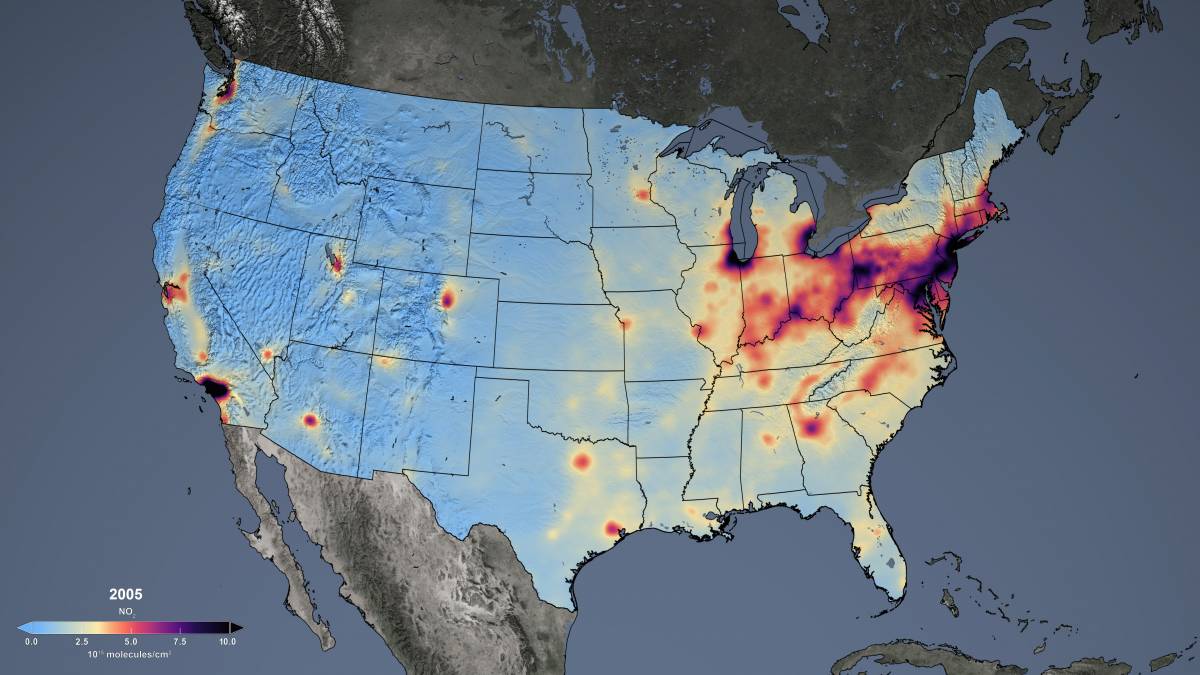
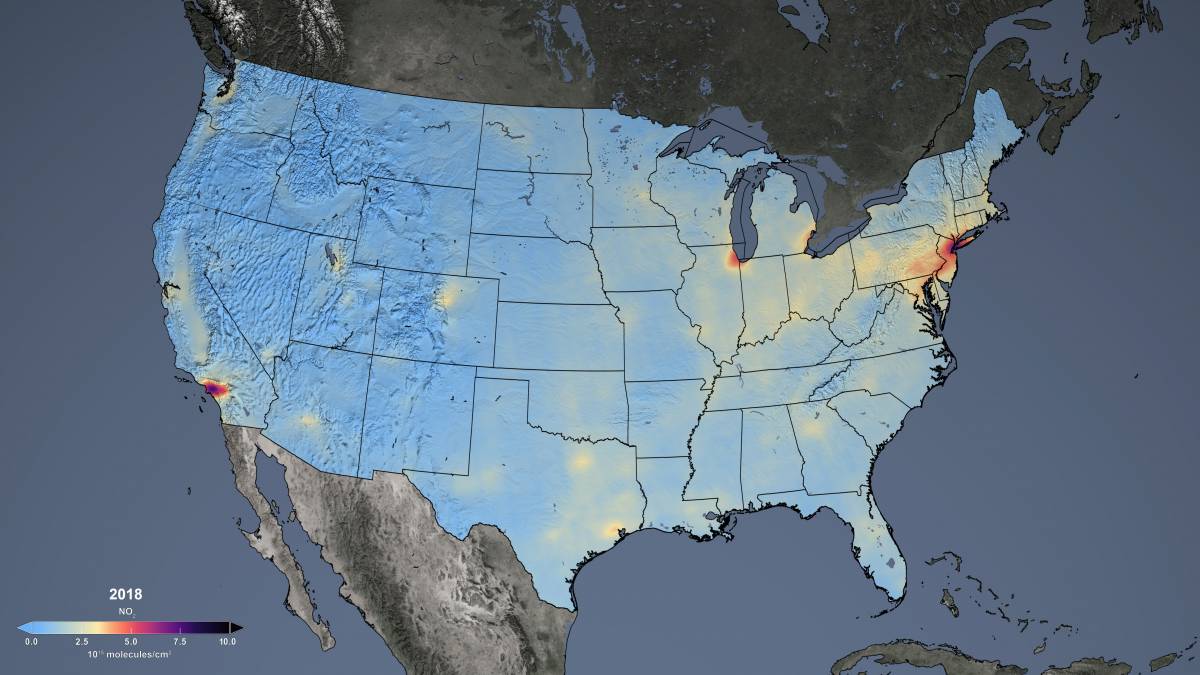
Satellite data are used to infer surface trends of PM and its chemical precursors (SO2, NO2, NH3), which have decreased in the eastern U.S. from 2005 to present.
SO2
Animations of annual mean SO2 (satellite data) over the eastern U.S. from 2005 to 2017.
Reconstructed animation of annual mean SO2 (based on satellite data) over the eastern U.S. from 1980 to 2015.
NH3
Satellite data of trends and variations in NH3 show a generally increasing trend in eastern Pennsylvania from 2008 to 2016.
Animation: "Seasonal Rhythms of Ammonia".
Images of NO2 for 2005 and 2018.
Animation of annual mean NO2 (satellite data) over the U.S. from 2005 to 2016.
Download ready-made plots of satellite NO2 trends (2005-2016) for various U.S. cities.
Trends (2005-2013) in satellite NO2 over major U.S. power plants.
International
SO2
Animations of annual mean SO2 (satellite data) over upwind source regions (India, China) from 2005 to 2017.
NO2
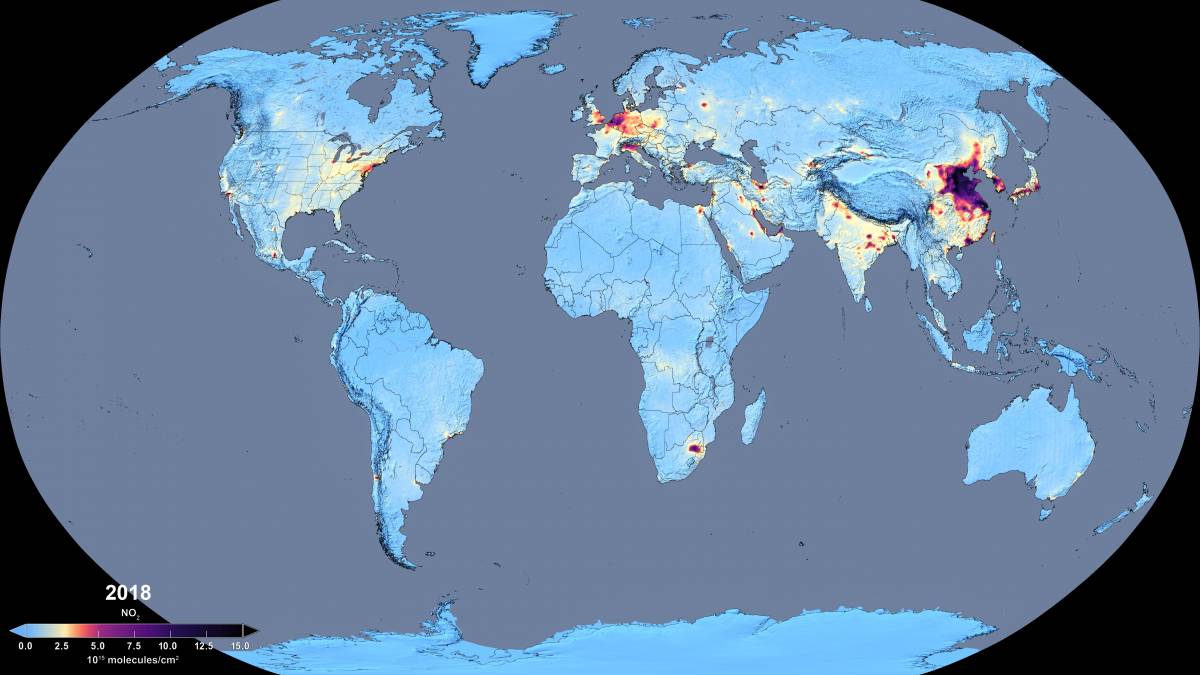
Images of NO2 over the globe for 2005 and 2018.
Download ready-made plots of satellite NO2 trends (2005-2016) for various world cities.
References
Duncan, B., et al., The observed response of Ozone Monitoring Instrument (OMI) NO2 columns to NOx emission controls on power plants in the United States: 2005-2011, Atmos. Environ., 81, p. 102-111, https://doi.org/10.1016/jatmosenv.2013.08.068, 2013.
Duncan, B.N., et al., A space-based, high-resolution view of notable changes in urban NOx pollution around the world (2005-2014), J. Geophys. Res., https://doi.org/10.1002/2015JD024121, 2016.
Fioletov, V., McLinden, C. A., Kharol, S. K., Krotkov, N. A., Li, C., Joiner, J., Moran, M. D., Vet, R., Visschedijk, A. J. H., and Denier van der Gon, H. A. C.: Multi-source SO2 emission retrievals and consistency of satellite and surface measurements with reported emissions, Atmos. Chem. Phys., 17, 12597-12616, https://doi.org/10.5194/acp-17-12597-2017, 2017.
de Foy, B., et al., Estimates of power plant NOx emissions and lifetimes from OMI NO2 satellite retrievals, Atmos. Environ., 116, 1-11, https://doi.org/10.1016/j.atmosenv.2015.05.056, 2015.
Krotkov, N.A., et al., Aura OMI observations of regional SO2 and NO2 pollution changes from 2005 to 2014, Atmos. Chem.Phys., https://dx.doi.org/10.5194/acpd-15-26555-2015, 2016.
Li, C., et al. 2017. India Is Overtaking China as the World’s Largest Emitter of Anthropogenic Sulfur Dioxide. Scientific Reports, 7 (1): 14304, https://doi.org/10.1038/s41598-017-14639-8.
Lu, Z., et al., Emissions of nitrogen oxides from US urban areas: estimation from Ozone Monitoring Instrument retrievals for 2005-2014, Atmos. Chem. Phys., 15, 10367-10383, https://doi.org/10.5194/acp-15-10367-2015, 2015.
Majid, A., et al. (2017), A decade of changes in nitrogen oxides over regions of oil and natural gas activity in the United States, Elementa: Science of the Anthropocene, 5:76. https://doi.org/10.1525/elementa.259.
HAQAST Lead: Dr. Arlene Fiore (amfiore@ldeo.columbia.edu)
HAQAST Participants: Dr. Bryan Duncan, Dr. Daven Henze, Dr. Patrick Kinney, Dr. Talat Odman, Dr. Ted Russell, Dr. Daniel Tong, Dr. Jason West, Dr. Mark Zondlo
Stakeholder Partners: Mid-Atlantic Regional Air management Association, Northeast States for Coordinated Air Use Management, Texas Commission on Environmental Quality, US EPA, Connecticut Department of Energy and Environmental Protection, Maine Department of Environmental Protection.