

Publicly available NASA satellite data can help with State Implementation Plans (SIPs)
NASA’s Earth science program maintains a large fleet of earth-observing satellites, all of which offer free data products. A number of these can be used to illustrate NOx emissions trends and their relevance to ozone attainment, as well as for weight-of-evidence under the EPA’s Exceptional Events Rule. A collaborative team of NASA-funded scientists and public stakeholders has recently developed a suite of easy-to-follow technical guidance documents to support state and local air quality agencies that want to bring the power of NASA’s satellites to bear on the documentation of exceptional events. This work is a product of the NASA Health and Air Quality Applied Sciences Team (HAQAST) Year 1 (2017-2018) Tiger Team “Supporting the Use of Satellite Data in State Implementation Plans (SIPs)”
What, specifically, can NASA help me with? Our team has developed four guidance documents:
-
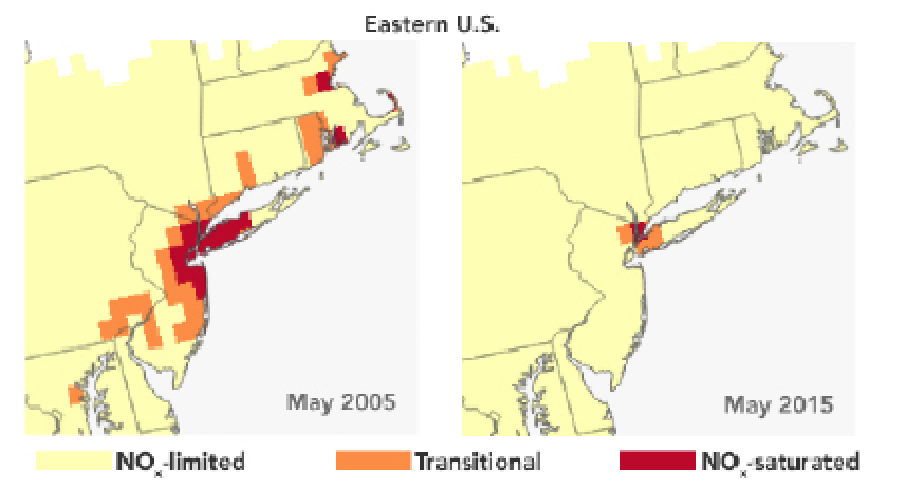
The change in the sensitivity of O3 formation from 2005 to 2015 as inferred from Aura OMI HCHO and NO2 data. This figure is based on the work of Jin et al. (2017). Figure credit: NASA.
Using satellite observed formaldehyde (HCHO) and nitrogen dioxide (NO2) as an indicator of ozone sensitivity in a SIP: Although State Implementation Plans (SIPs) typically rely on observations from ground-based networks and regulatory models, satellite data is increasingly available to state agencies and can also inform and supplement state implementation plans to improve air quality. An advantage of satellite data is that it provides information for a broader area than sampled by ground-based networks. This document provides examples and guidance for using satellite products of formaldehyde (HCHO) and nitrogen dioxide (NO2) to inform ground-level ozone sensitivity to emissions of nitrogen oxides (NOx) versus volatile organic compounds (VOC) in state implementation plans. Analysis of changes in ozone sensitivity over periods where emission controls have been implemented can provide insights into the efficacy of those past strategies and the likely efficacy of proposed future emission control programs.
- A Brief Tutorial on Using the Ozone Monitoring Instrument (OMI) Nitrogen Dioxide (NO2) Data Product for SIP Preparation: Although State Implementation Plans (SIPs) typically rely on observations from ground-level monitoring networks and regulatory modeling, satellite data is increasingly available to state agencies. This document includes an example of how one state agency used satellite data to supplement a state implementation plan to improve air quality. An advantage of satellite data is that it provides information for a broader area than sampled by ground-based networks. This document provides examples and guidance for using satellite products of nitrogen dioxide (NO2), a precursor to ground-level ozone and nitrate aerosol, in state implementation plans. It also provides some guidance on using SO2, a precursor to sulfate aerosol.
- Guide to Using Satellite Images in Support of Exceptional Event Demonstrations:
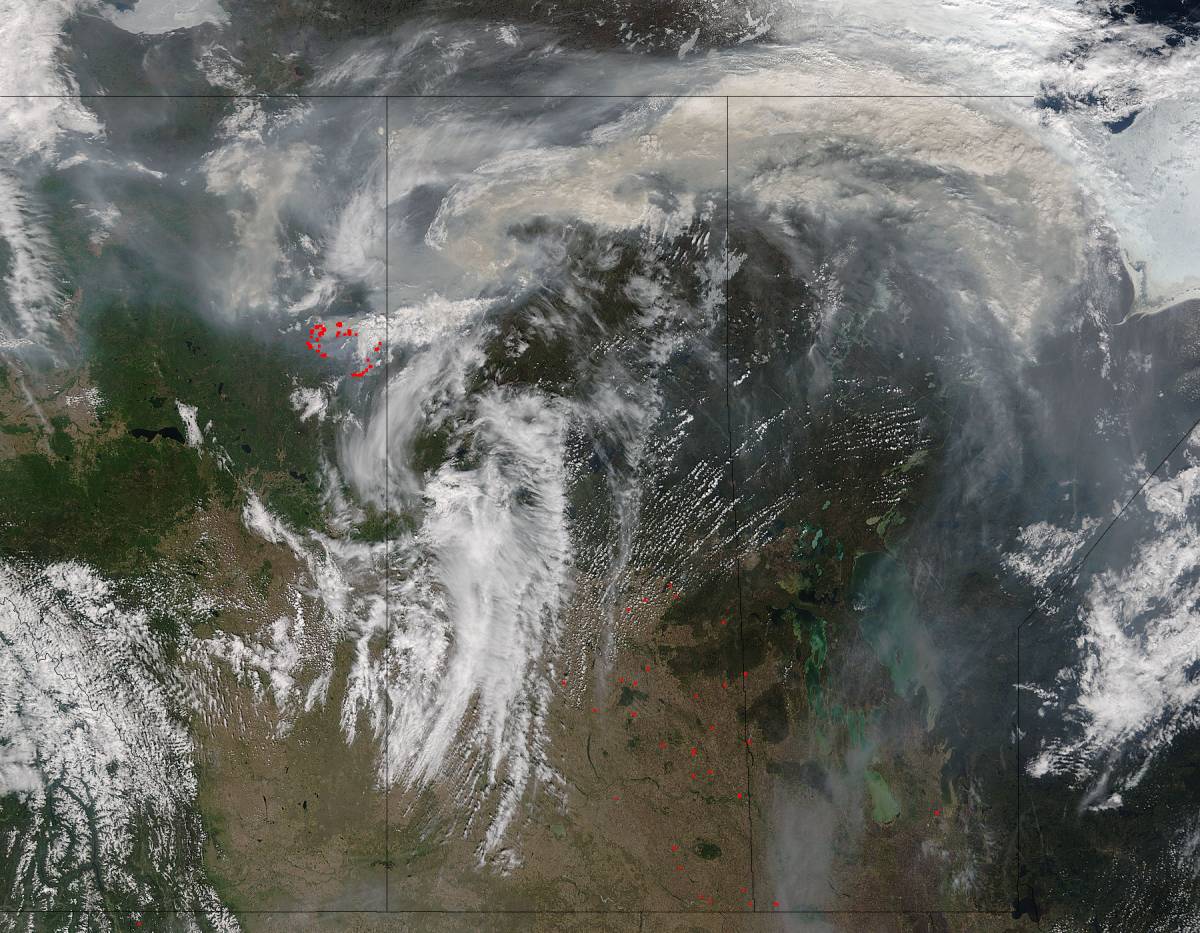
True color image of the widespread impact of the Fort McMurray wildfires in May 2016 on air quality in the U.S. Figure credit: NASA.
The Exceptional Events Rule, contained in Title 40 of the Code of Federal Regulations Part 50.14 (40CFR50.14), was revised by EPA in October of 2016. Many elements go into technical support documents for an exceptional event. This technical guidance document provides information regarding satellite images and data that can be used to support the weight of evidence. Examples shown in this document played a critical role for the State of Connecticut in its successful demonstration to exclude ozone data from May 25-26, 2016 at several of its monitors because of the transport of pollutants from the wildfires at Fort McMurray, Alberta, Canada.
- Comparison of CMAQ Simulation to Satellite Observations: NO₂ Column versus OMI NO2: Compared to sparse ground-based monitoring, satellite observations have coverage in unmonitored areas. While satellite data can thus provide broad spatial distributions for evaluation of regional air quality models, several steps are needed to convert the quantities retrieved from spaceborne instruments and simulated by models for a quantitative comparison. This document describes a procedure for comparing tropospheric nitrogen dioxide (NO2) columns simulated by the regional CMAQ model to those retrieved from the OMI satellite, with an example application in the Great Lakes Region.
Have air quality managers used satellite data in submitted SIPs?
Yes. Our technical guidance documents were developed in close concert with air-quality experts at a number of state agencies, including the Texas Commission on Environmental Quality (TCEQ) and Connecticut’s Department of Energy and Environmental Protection (DEEP). Satellite data can be used as one component of your overall weight of evidence (alongside evidence from ground monitors, models, etc.) Our technical guidance documents provide field-tested examples of successful uses.
⇒ Our team also developed a short “how-to” document that describes how to create regional-scale time series using NASA GIOVANNI.
HAQAST Lead: Dr. Arlene Fiore (amfiore@ldeo.columbia.edu)
HAQAST Participants: Dr. Bryan Duncan, Dr. Jessica Neu, Dr. Daven Henze, Dr. Talat Odman, Dr. Ted Russell, Dr. Daniel Tong, Dr. Mark Zondlo, Dr. Jonathan Patz, Dr. Tracey Holloway, Dr. Jeremy Hess
Stakeholder Partners: South Coast Air Quality Management District, Mid-Atlantic Regional Air management Association, Northeast States for Coordinated Air Use Management, Georgia Environmental Protection Division, Texas Commission on Environmental Quality, Bay Area Air Quality Management District, US EPA, Connecticut Department of Energy and Environmental Protection.