

Africa
Most African cities have low NO2 levels relative to the US, Western Europe and East Asia. Over the last decade, there was a mix of changes in NO2 levels over the continent. The largest increase (75%) occurred over Luanda, Angola’s only major city, which has a metropolitan population of ~6.5 million. The city’s increase in NO2 levels is consistent with the country’s strong population growth (~38% from 2005 to 2016) and economic development (i.e., 116% increase in GDP (constant 2005 US$) from 2005 to 2016), following the end of decades of civil war in 2002. Cities with decreases were Tripoli (Libya), which may be associated with the impact of civil war on the country's economy, and all major cities in South Africa likely because of environmental regulations on NOx emissions from automobiles. Both areas of increases and decreases occur near Johannesburg (South Africa), which are likely associated with changes in power plant emissions.
South Africa Average NO2 Trends, 2014
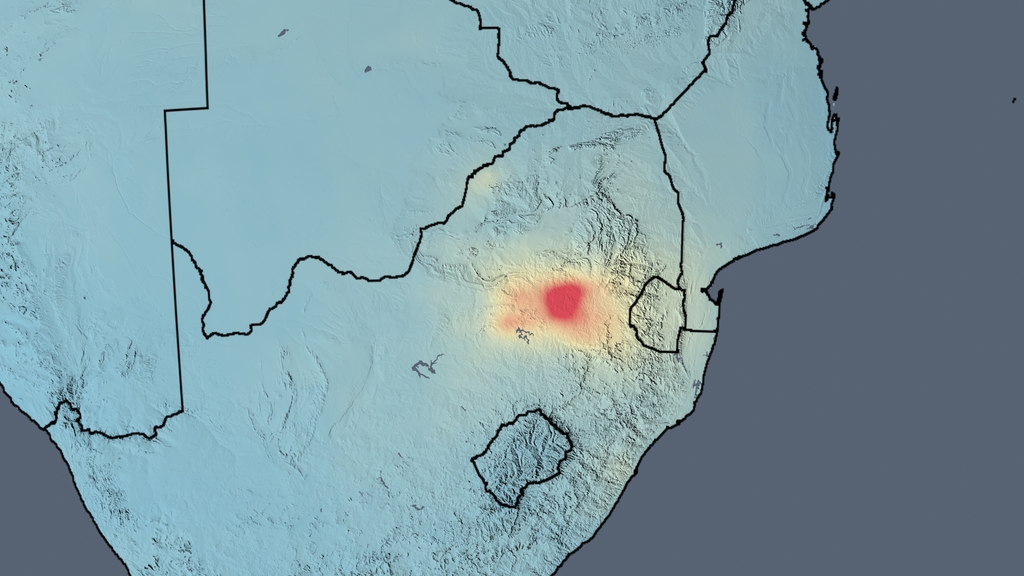
NO2 levels in South Africa, averaged over 2014. The hotspot is just to the east of the Johannesburg-Pretoria megacity. It is an area of intense thermal (i.e., coal) power generation, mining, metallurgy, etc. South Africa has most of Africa's coal reserves and most of the world's platinum reserves.
South Africa NO2 Trends, 2005-2016
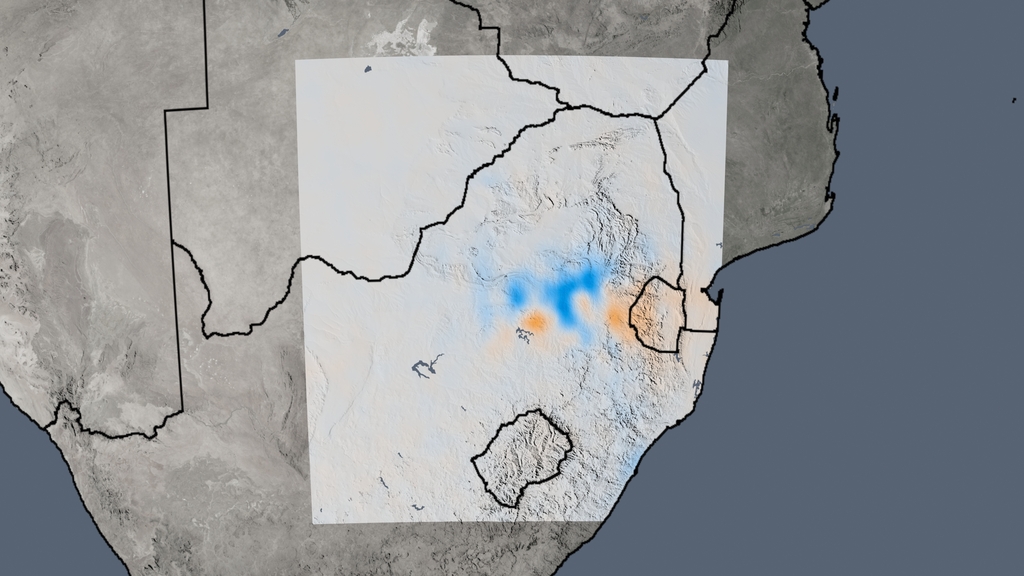
The trend map of South Africa shows the change in NO2 levels from 2005 to 2016. The changes are largely due to decreases in power plant emissions to the east of Johannesburg and mobile source emissions within Johannesburg itself. The areas of increases are likely associated with the reactivation of three shuttered power plants in 2010.
| City | Country | Region | 2021 Average NO2 | Change (%) | Uncertainty (±%) |
|---|---|---|---|---|---|
| Abidjan | Cote dIvoire |
Africa | 8.605e+14 | 15.6117 | 7.54 |
| Accra | Ghana |
Africa | 8.674e+14 | 19.3979 | 10.21 |
| Addis Ababa | Ethiopia |
Africa | 7.915e+14 | 21.7678 | 7.41 |
| Aleppo | Syria |
Africa | 1.754e+15 | -36.1157 | 9.11 |
| Algiers | Algeria |
Africa | 3.098e+15 | 30.5452 | 8.47 |
| Arnot power station | South Africa |
Africa | 6.762e+15 | -32.9441 | 7.40 |
| Asmara | Eritrea |
Africa | 6.056e+14 | 10.1229 | 7.14 |
| Bamako | Mali |
Africa | 1.131e+15 | 29.3305 | 10.48 |
| Banjul | Gambia |
Africa | 8.234e+14 | 10.7380 | 9.50 |
| Bata | Equatorial Guinea |
Africa | 3.286e+14 | 17.7140 | 15.21 |
| Bissau | Guinea Bissau |
Africa | 5.671e+14 | -8.07885 | 10.11 |
| Brazzaville | Rep. of Congo |
Africa | 1.227e+15 | 14.3852 | 20.20 |
| Cape Town | South Africa |
Africa | 1.213e+15 | -25.0312 | 6.61 |
| Centrale Thermique de Jorf Lasfar | Morocco |
Africa | 1.681e+15 | 17.6787 | 7.20 |
| Colombo | Sri Lanka |
Africa | 8.343e+14 | -0.915646 | 12.94 |
| Conakry | Guinea |
Africa | 5.402e+14 | 9.82290 | 14.38 |
| Dakar | Senegal |
Africa | 1.127e+15 | 72.5362 | 12.25 |
| Dar Es Salaam | Tanzania |
Africa | 7.582e+14 | 8.66165 | 12.82 |
| Djibouti | Djibouti |
Africa | 6.708e+14 | 8.81741 | 6.20 |
| Durban | South Africa |
Africa | 2.071e+15 | -22.6756 | 7.30 |
| Duvha power station | South Africa |
Africa | 9.176e+15 | -26.9724 | 8.10 |
| Gaborone | Botswana |
Africa | 1.185e+15 | 8.52055 | 9.69 |
| Harare | Zimbabwe |
Africa | 1.223e+15 | 18.6364 | 16.73 |
| Johannesburg | South Africa |
Africa | 5.721e+15 | -16.7508 | 11.87 |
| Kampala | Kampala |
Africa | 8.928e+14 | -5.95973 | 8.00 |
| Kano | Nigeria |
Africa | 1.303e+15 | 28.6913 | 9.31 |
| Kendal power station | South Africa |
Africa | 8.211e+15 | -22.5500 | 9.77 |
| Khartoum | Sudan |
Africa | 1.365e+15 | 29.1918 | 5.95 |
| Kinshasa | Congo |
Africa | 1.252e+15 | 12.1978 | 20.69 |
| Kriel power station | South Africa |
Africa | 9.684e+15 | -23.0799 | 6.77 |
| Laayoune | Western Sahara |
Africa | 5.559e+14 | 37.6455 | 9.62 |
| Lagos | Nigeria |
Africa | 1.267e+15 | 32.3726 | 14.67 |
| Lethabo power station | South Africa |
Africa | 5.933e+15 | -6.52774 | 10.84 |
| Libreville | Gabon |
Africa | 4.408e+14 | 24.7439 | 15.74 |
| Lilongwe | Malawi |
Africa | 1.259e+15 | 5.44557 | 8.83 |
| Lome | Togo |
Africa | 7.103e+14 | 18.1017 | 11.63 |
| Luanda | Angola |
Africa | 9.106e+14 | 18.9029 | 26.46 |
| Majuba power station | South Africa |
Africa | 4.817e+15 | -13.2263 | 9.16 |
| Maseru | Lesotho |
Africa | 9.340e+14 | -6.82905 | 8.92 |
| Matimba power station | South Africa |
Africa | 3.028e+15 | 38.1549 | 9.83 |
| Matla power station | South Africa |
Africa | 9.027e+15 | -21.8063 | 7.64 |
| Mbarara | Africa |
Africa | 6.508e+14 | -1.81061 | 10.14 |
| Nairobi | Kenya |
Africa | 8.186e+14 | 0.852284 | 10.27 |
| NDjamena | Chad |
Africa | 9.766e+14 | 12.3889 | 10.47 |
| Niamey | Niger |
Africa | 8.363e+14 | 27.9230 | 8.98 |
| Nouakchott | Mauritania |
Africa | 7.012e+14 | 14.6329 | 6.69 |
| Ouagadougou | Burkina Faso |
Africa | 9.790e+14 | 32.8023 | 10.64 |
| Porto Novo | Benin |
Africa | 9.186e+14 | 24.2017 | 10.06 |
| Rabat | Morocco |
Africa | 1.929e+15 | 15.3008 | 7.98 |
| Tananarive | Madagascar |
Africa | 8.441e+14 | 31.8502 | 10.71 |
| Tripoli | Libya |
Africa | 2.045e+15 | -8.36294 | 6.11 |
| Tunis | Tunisia |
Africa | 7.962e+14 | 17.4719 | 6.34 |
| Tutuka power station | South Africa |
Africa | 6.567e+15 | -19.0745 | 7.90 |
| Windhoek | Namibia |
Africa | 5.524e+14 | 6.78189 | 10.67 |
| Yaounde | Cameroon |
Africa | 5.461e+14 | 33.9685 | 18.31 |