
Smog in Shanghai, China

News

Human Fingerprint on Global Air Quality

This video provides an overview of the study findings.  For more information, read the full story on nasa.gov.  To download a copy, please visit the release on the NASA GSFC Scientific and Visualization Studio website.  Click here to read a transcript of the video.

Global ABS Visualization for 2014Global ABS Visualization for 2005 Global ABS Visualization for 2014

Before and After: World Nitrogen Dioxide Levels, 2005-2016

These global maps show NO2 levels in the atmosphere as detected by the Ozone Monitoring Instrument aboard the Aura satellite, averaged over 2005 and 2014, respectively.

Global Air Quality Press Conference, AGU 2015

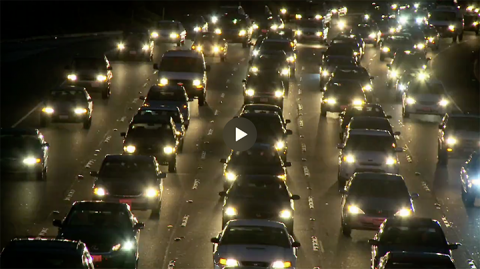
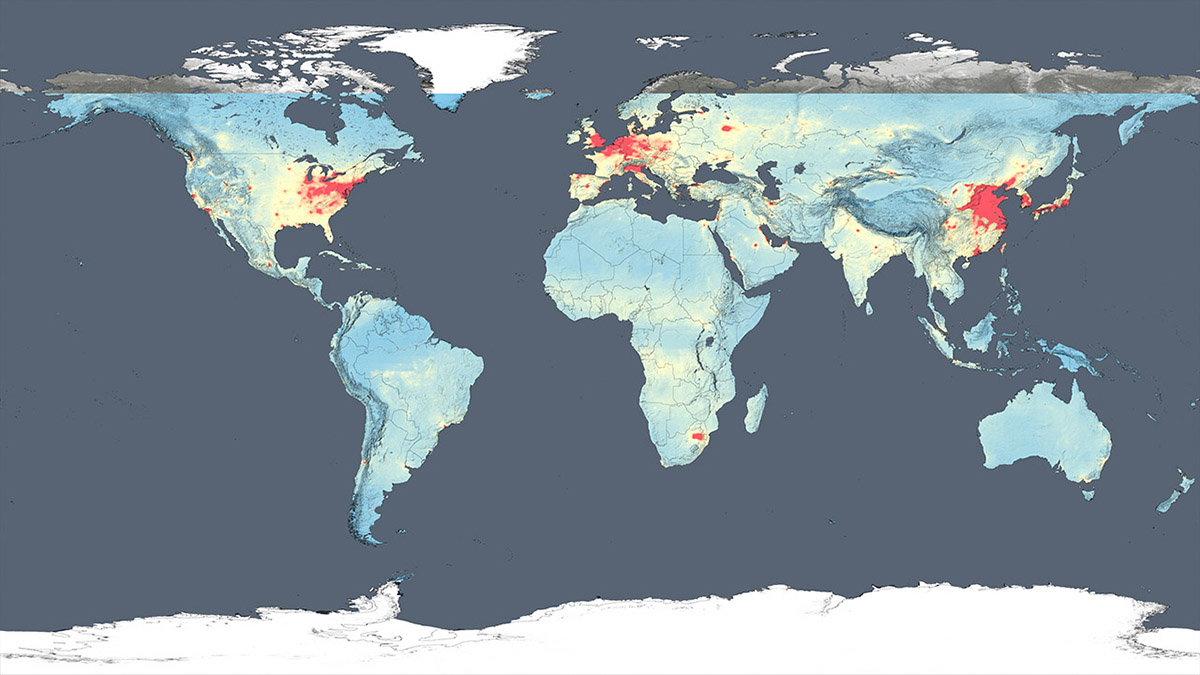
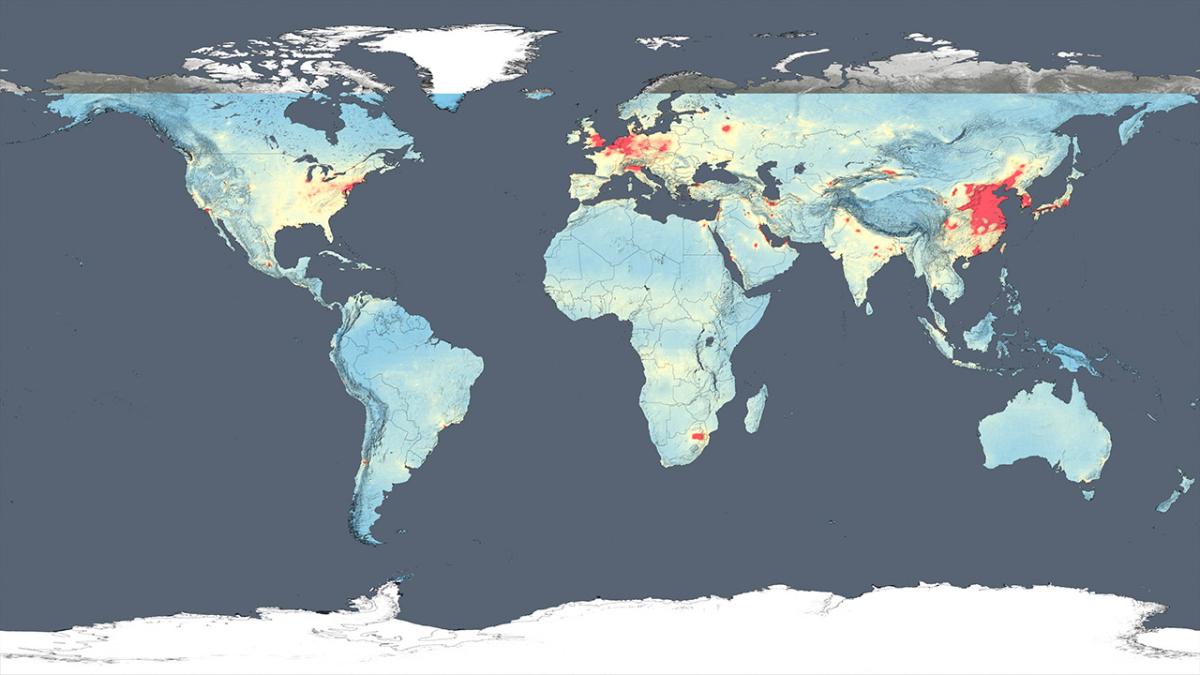
Air pollution’s rise and fall is a hallmark of industrialization, economic activity, and even civil unrest – and it can have far reaching effects on human health and the environment. Now, NASA has produced the first high-resolution global map of air quality. In this briefing, scientists will discuss the evolving human impact.

November 30, 2015: Beijing Air Quality Index (AQI) Reaches 611

Beijing's AQI reached an incredible level of 611.  Levels above 500 are simply referred to as being "beyond scale".

A Tale of Three Cities: Beijing, Los Angeles and Atlanta

In February 2015, Bryan Duncan (NASA scientist) gave a Ted-style talk on air quality as seen from space.  You can also view the video on the main NASA website.