

Europe
There are large decreases in OMI NO2 levels from 2005 to 2016 over European cities, which are due to tightening vehicle emission standards. The largest decreases (−45-−55%) occur over the major cities of the Iberian Peninsula (Madrid and Barcelona (Spain), Lisbon (Portugal)) and Athens (Greece). Some of the decrease in Spain and Greece may have occurred as their economies have been slow to recover after the global economic recession that began in 2008. Large decreases occurred over other major cities, such as Paris, London (United Kingdom), Moscow (Russia), and those in the Netherlands, Belgium, and the industrialized Po River Valley (Italy) and Ruhr region (Germany).
European Regional Changes in NO2, 2005-2016
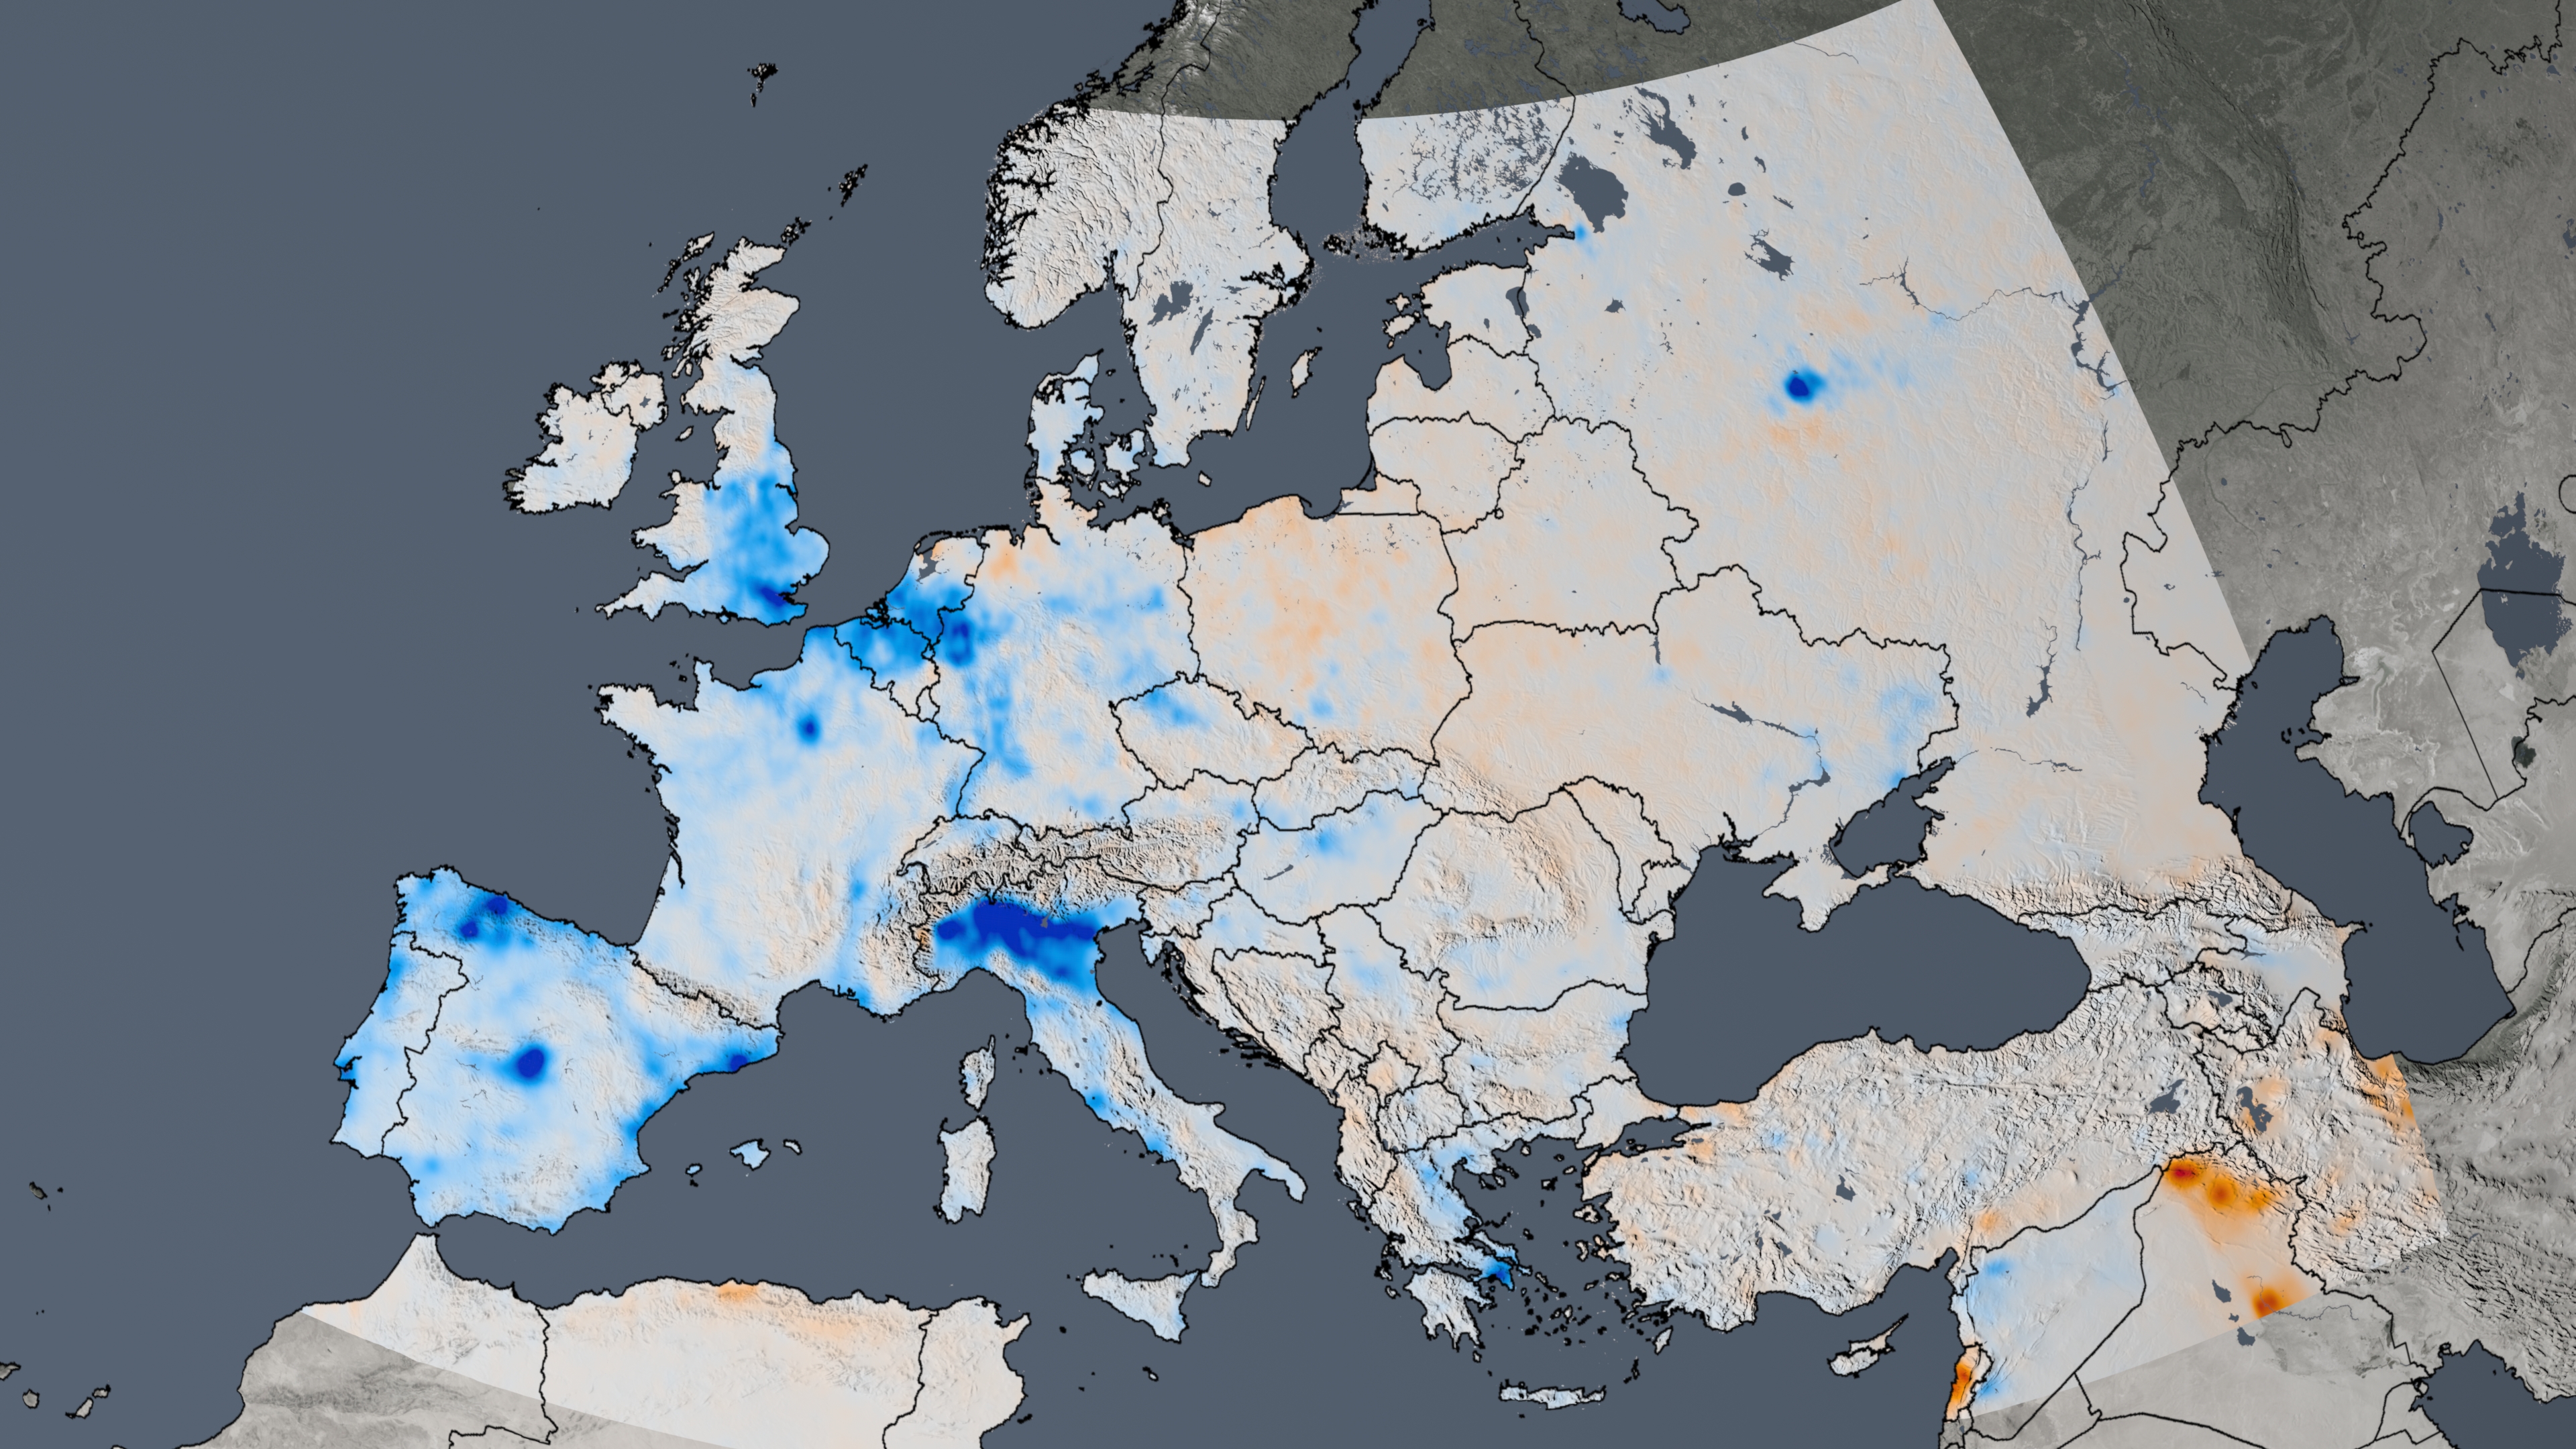
The trend map of Europe shows the change in nitrogen dioxide concentrations from 2005 to 2016.
| City | Country | Region | 2021 Average NO2 | Change (%) Sort ascending | Uncertainty (±%) |
|---|---|---|---|---|---|
| Burshtyn power station | Ukraine |
Europe | 1.831e+15 | 6.33254 | 12.42 |
| Moldavskaya GRES | Moldova |
Europe | 1.661e+15 | 5.65631 | 9.55 |
| Baku | Azerbaijan |
Europe | 3.042e+15 | 30.7511 | 9.55 |
| Yerevan | Armenia |
Europe | 2.206e+15 | 29.8018 | 14.77 |
| Tbilisi | Georgia |
Europe | 1.619e+15 | 17.4324 | 10.64 |
| Vilnius | Lithuania |
Europe | 1.499e+15 | 12.7821 | 15.24 |
| Riga | Latvia |
Europe | 1.178e+15 | 1.77816 | 12.44 |
| Tallinn | Estonia |
Europe | 1.104e+15 | 0.213837 | 10.90 |
| Zainskaya GRES | Russia |
Europe | 1.513e+15 | -9.60238 | 15.45 |
| Permskaya | Russia |
Europe | 1.254e+15 | -9.02244 | 14.75 |
| Reykjavik | Iceland |
Europe | 3.196e+14 | -7.97073 | 18.97 |
| Stavropolskaya GRES | Russia |
Europe | 1.697e+15 | -7.78812 | 9.38 |
| West Burton | UK |
Europe | 4.041e+15 | -61.8603 | 8.61 |
| Cottam | UK |
Europe | 3.837e+15 | -61.6277 | 8.58 |
| Manchester | England |
Europe | 3.366e+15 | -59.0115 | 11.36 |
| London | United Kingdom |
Europe | 4.780e+15 | -58.9777 | 10.66 |
| Madrid | Spain |
Europe | 3.227e+15 | -56.8119 | 6.09 |
| Paris | France |
Europe | 4.501e+15 | -54.7252 | 8.47 |
| Barcelona | Spain |
Europe | 3.176e+15 | -54.2173 | 5.34 |
| Birmingham | England |
Europe | 3.081e+15 | -53.7590 | 11.04 |
| Milan | Italy |
Europe | 7.175e+15 | -51.8521 | 6.34 |
| Marseilles | France |
Europe | 2.211e+15 | -51.8434 | 6.35 |
| Rome | Italy |
Europe | 2.125e+15 | -50.2306 | 5.51 |
| Edinburgh | Scotland |
Europe | 1.865e+15 | -49.9464 | 8.98 |
| Leeds | England |
Europe | 3.511e+15 | -49.8567 | 13.55 |
| Bristol | England |
Europe | 2.264e+15 | -49.8013 | 12.20 |
| Brussels | Belgium |
Europe | 5.481e+15 | -47.8768 | 9.62 |
| CHP 23 | Russia |
Europe | 7.966e+15 | -47.5137 | 12.19 |
| Porcheville | France |
Europe | 3.227e+15 | -47.3400 | 12.15 |
| Moscow | Russia |
Europe | 7.810e+15 | -47.3084 | 12.04 |
| Liverpool | England |
Europe | 2.201e+15 | -47.2975 | 16.66 |
| Port of Ghent | Belgium |
Europe | 6.038e+15 | -46.3783 | 10.95 |
| Port of Dunkirk | France |
Europe | 4.528e+15 | -46.0707 | 10.72 |
| Athens | Greece |
Europe | 2.930e+15 | -45.8480 | 7.45 |
| Troitskaya GRES | Russia |
Europe | 9.244e+14 | -45.7854 | 15.55 |
| Essen | Germany |
Europe | 7.380e+15 | -44.7486 | 7.63 |
| Venice | Italy |
Europe | 4.900e+15 | -44.5899 | 7.12 |
| Niederaussem power station | Germany |
Europe | 6.774e+15 | -43.7643 | 8.75 |
| BoA 2 | Germany |
Europe | 6.747e+15 | -43.0069 | 8.88 |
| Neurath power station | Germany |
Europe | 6.747e+15 | -43.0069 | 8.88 |
| Pembroke | UK |
Europe | 8.966e+14 | -42.5699 | 13.83 |
| Lisbon | Portugal |
Europe | 1.879e+15 | -42.2720 | 7.06 |
| Glasgow | Scotland |
Europe | 1.582e+15 | -41.6188 | 12.03 |
| Lyons | France |
Europe | 2.454e+15 | -41.1181 | 6.84 |
| Vladivostok | Russia |
Europe | 2.218e+15 | -4.59428 | 12.07 |
| Naples | Italy |
Europe | 2.479e+15 | -39.7403 | 6.97 |
| Zmiivska power station | Ukraine |
Europe | 1.622e+15 | -39.3465 | 17.70 |
| Frankfurt | Germany |
Europe | 5.206e+15 | -39.1340 | 10.45 |
| Gersteinwerk | Germany |
Europe | 4.939e+15 | -39.0788 | 12.13 |
| Vuglegirska power station | Ukraine |
Europe | 2.686e+15 | -38.9569 | 12.45 |
| Donetsk | Ukraine |
Europe | 2.851e+15 | -37.7126 | 11.26 |
| Mariupol | Ukraine |
Europe | 1.975e+15 | -36.7918 | 7.55 |
| Belfast | Northern Ireland |
Europe | 1.514e+15 | -36.5319 | 9.08 |
| Copenhagen | Denmark |
Europe | 2.126e+15 | -36.5057 | 10.88 |
| Bordeaux | France |
Europe | 1.596e+15 | -34.9013 | 7.43 |
| Newcastle on Tyne | England |
Europe | 2.194e+15 | -34.4576 | 11.06 |
| Aberdeen | Scotland |
Europe | 1.324e+15 | -33.6171 | 8.75 |
| Nizhnevartovskaya | Russia |
Europe | 7.697e+14 | -32.3822 | 8.99 |
| Porto Tolle | Italy |
Europe | 4.046e+15 | -31.1916 | 12.34 |
| Oslo | Norway |
Europe | 1.560e+15 | -31.1152 | 9.34 |
| Plymouth | England |
Europe | 1.327e+15 | -30.6883 | 12.23 |
| Kharkiv | Ukraine |
Europe | 1.935e+15 | -30.3445 | 17.73 |
| Azerbaijan TPP | Azerbaijan |
Europe | 1.779e+15 | -3.32576 | 9.00 |
| Reftinskaya GRES | Russia |
Europe | 2.942e+15 | -29.9889 | 12.65 |
| Dublin | Ireland |
Europe | 1.467e+15 | -29.5891 | 9.65 |
| Hamburg | Germany |
Europe | 3.565e+15 | -29.5637 | 12.32 |
| Helsinki | Finland |
Europe | 1.431e+15 | -29.4102 | 8.32 |
| Amsterdam | Netherlands |
Europe | 4.507e+15 | -29.2377 | 10.48 |
| Zurich | Switzerland |
Europe | 2.811e+15 | -28.7843 | 9.22 |
| Brindisi Sud power station | Italy |
Europe | 1.749e+15 | -28.2738 | 6.95 |
| Berlin | Germany |
Europe | 3.668e+15 | -27.9769 | 11.05 |
| Belchatow | Poland |
Europe | 3.845e+15 | -27.9487 | 11.68 |
| Montalto | Italy |
Europe | 1.224e+15 | -27.5443 | 7.79 |
| Bremen | Germany |
Europe | 3.750e+15 | -27.3962 | 12.31 |
| Zaporizhia power station | Ukraine |
Europe | 2.205e+15 | -27.0293 | 9.31 |
| Brandenburg | Germany |
Europe | 3.172e+15 | -26.5897 | 11.84 |
| Eems | Netherlands |
Europe | 3.025e+15 | -26.4881 | 10.99 |
| Kozienice | Poland |
Europe | 2.652e+15 | -25.7885 | 13.25 |
| Munich | Germany |
Europe | 2.690e+15 | -25.5527 | 11.18 |
| Stockholm | Sweden |
Europe | 1.507e+15 | -25.4325 | 7.28 |
| Saint Petersburg | Russia |
Europe | 3.498e+15 | -25.1631 | 9.09 |
| Surgutskaya GRES 2 | Russia |
Europe | 1.128e+15 | -24.7089 | 8.38 |
| Vienna | Austria |
Europe | 3.456e+15 | -24.4911 | 9.92 |
| Warsaw | Poland |
Europe | 3.147e+15 | -22.3984 | 15.74 |
| Budapest | Hungary |
Europe | 3.359e+15 | -22.0606 | 8.32 |
| Kyiv | Ukraine |
Europe | 2.503e+15 | -20.7838 | 13.41 |
| Prague | Czech Republic |
Europe | 3.997e+15 | -19.0529 | 11.53 |
| Konakovskaya | Russia |
Europe | 2.123e+15 | -17.1269 | 15.94 |
| Sofia | Bulgaria |
Europe | 1.989e+15 | -17.0062 | 10.26 |
| Iriklinskaya | Russia |
Europe | 9.007e+14 | -16.7579 | 14.16 |
| Minsk | Belarus |
Europe | 1.569e+15 | -16.7031 | 13.47 |
| Janschwalde power station | Germany |
Europe | 3.769e+15 | -16.4800 | 12.04 |
| Belgrade | Serbia |
Europe | 3.316e+15 | -15.7182 | 8.79 |
| Bucharest | Romania |
Europe | 2.637e+15 | -15.1587 | 6.84 |
| Berezovskaya GRES | Russia |
Europe | 1.076e+15 | -14.3430 | 13.94 |
| Boxberg power station | Germany |
Europe | 3.663e+15 | -12.9805 | 11.48 |
| Lukoml Thermal Power Plant Belarus | Belarus |
Europe | 1.116e+15 | -12.9741 | 17.04 |
| Kirishskaya GRES | Russia |
Europe | 1.360e+15 | -12.5082 | 12.96 |
| Krostromskaya | Russia |
Europe | 2.022e+15 | -12.1158 | 16.30 |
| Odessa | Ukraine |
Europe | 1.926e+15 | -10.8881 | 8.33 |
| Novocherkasskaya GRES | Russia |
Europe | 2.596e+15 | -10.1647 | 11.53 |
| Kherson | Ukraine |
Europe | 1.594e+15 | -0.907160 | 9.32 |