

Alexandria
Country:
Egypt
Year:
2021
Average NO2:
1.992e+15
Uncertainty (±%):
8.11
Image
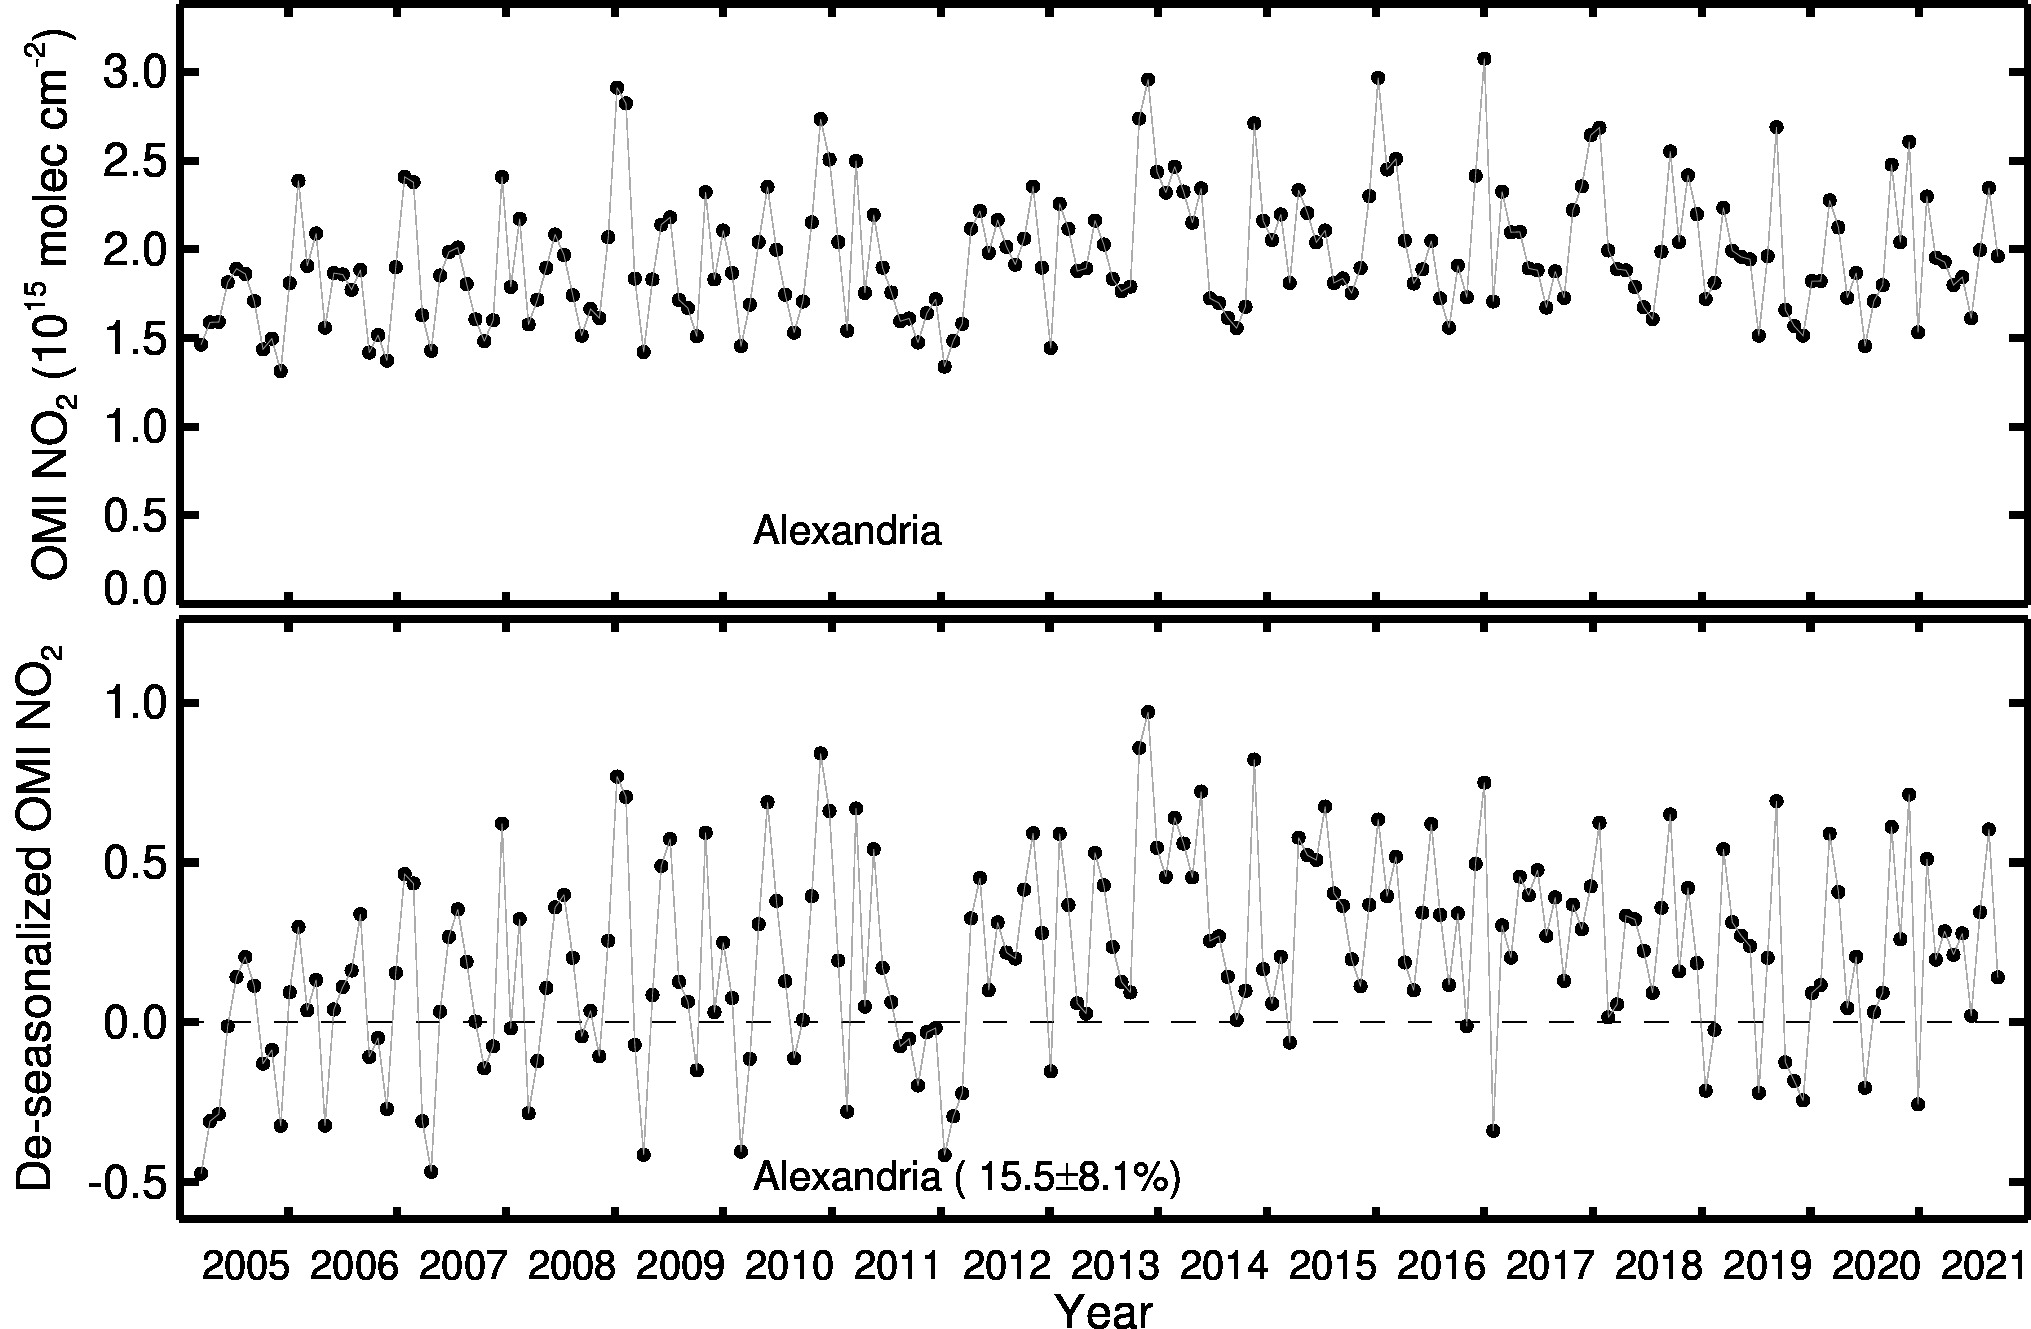
Alexandria Line Plot 2005-2021
Alexandria OMI data between 2005-2021.
Image
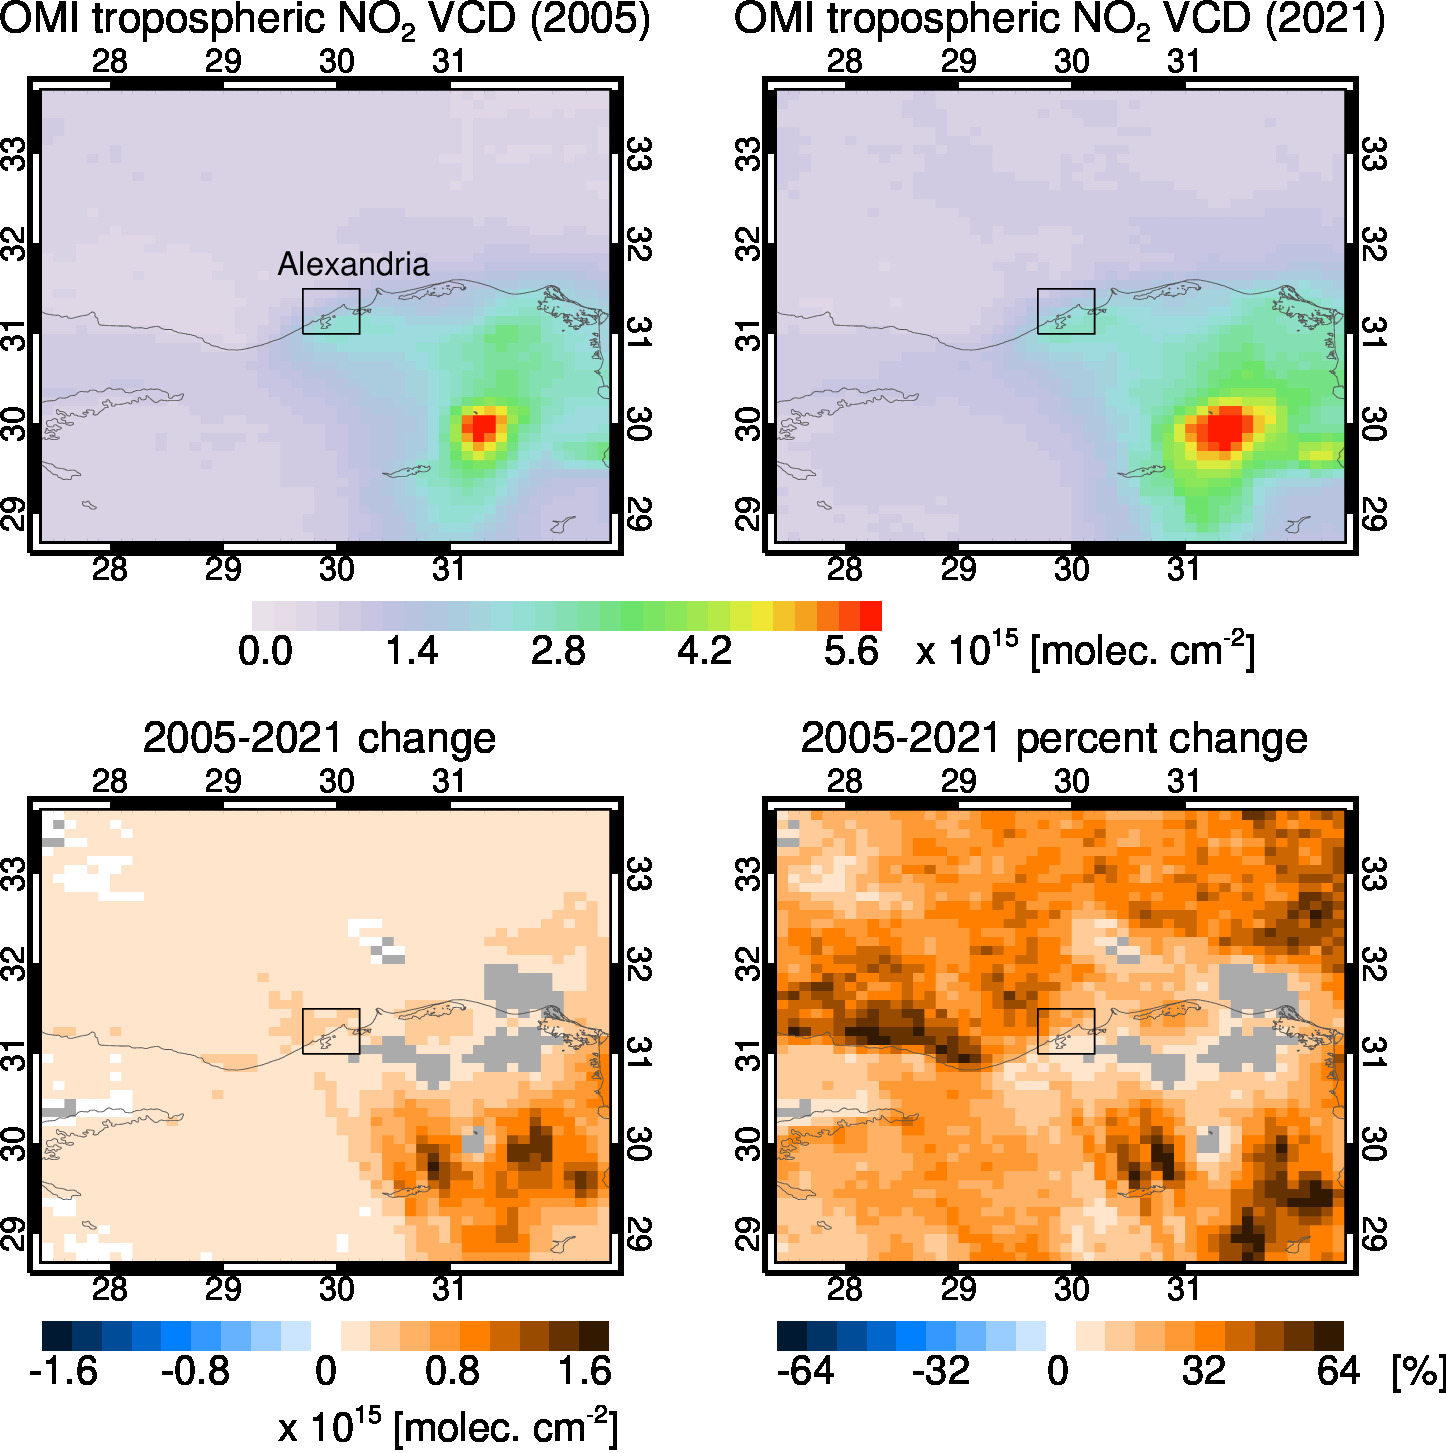
Alexandria City Trend 2005-2021
Alexandria OMI data between 2005-2021.