Skip to main content
Air Quality
Observations from Space
Main navigation
Home
Trace gases
Nitrogen Dioxide
NO2 Trends Overview
NO2 Trends for World Cities
NO2 Trends for Power Plants
NO2 Trends for US Cities
US Air Quality Trends
Ozone
Particulate Matter
Impacts
Human Health
Food Security
COVID-19
News
Resources
Model Forecast
Webtools & Data
Factsheets
AQ Websites
Outreach
References
Due to the lapse in federal government funding, NASA is not updating this website. We sincerely regret this inconvenience.
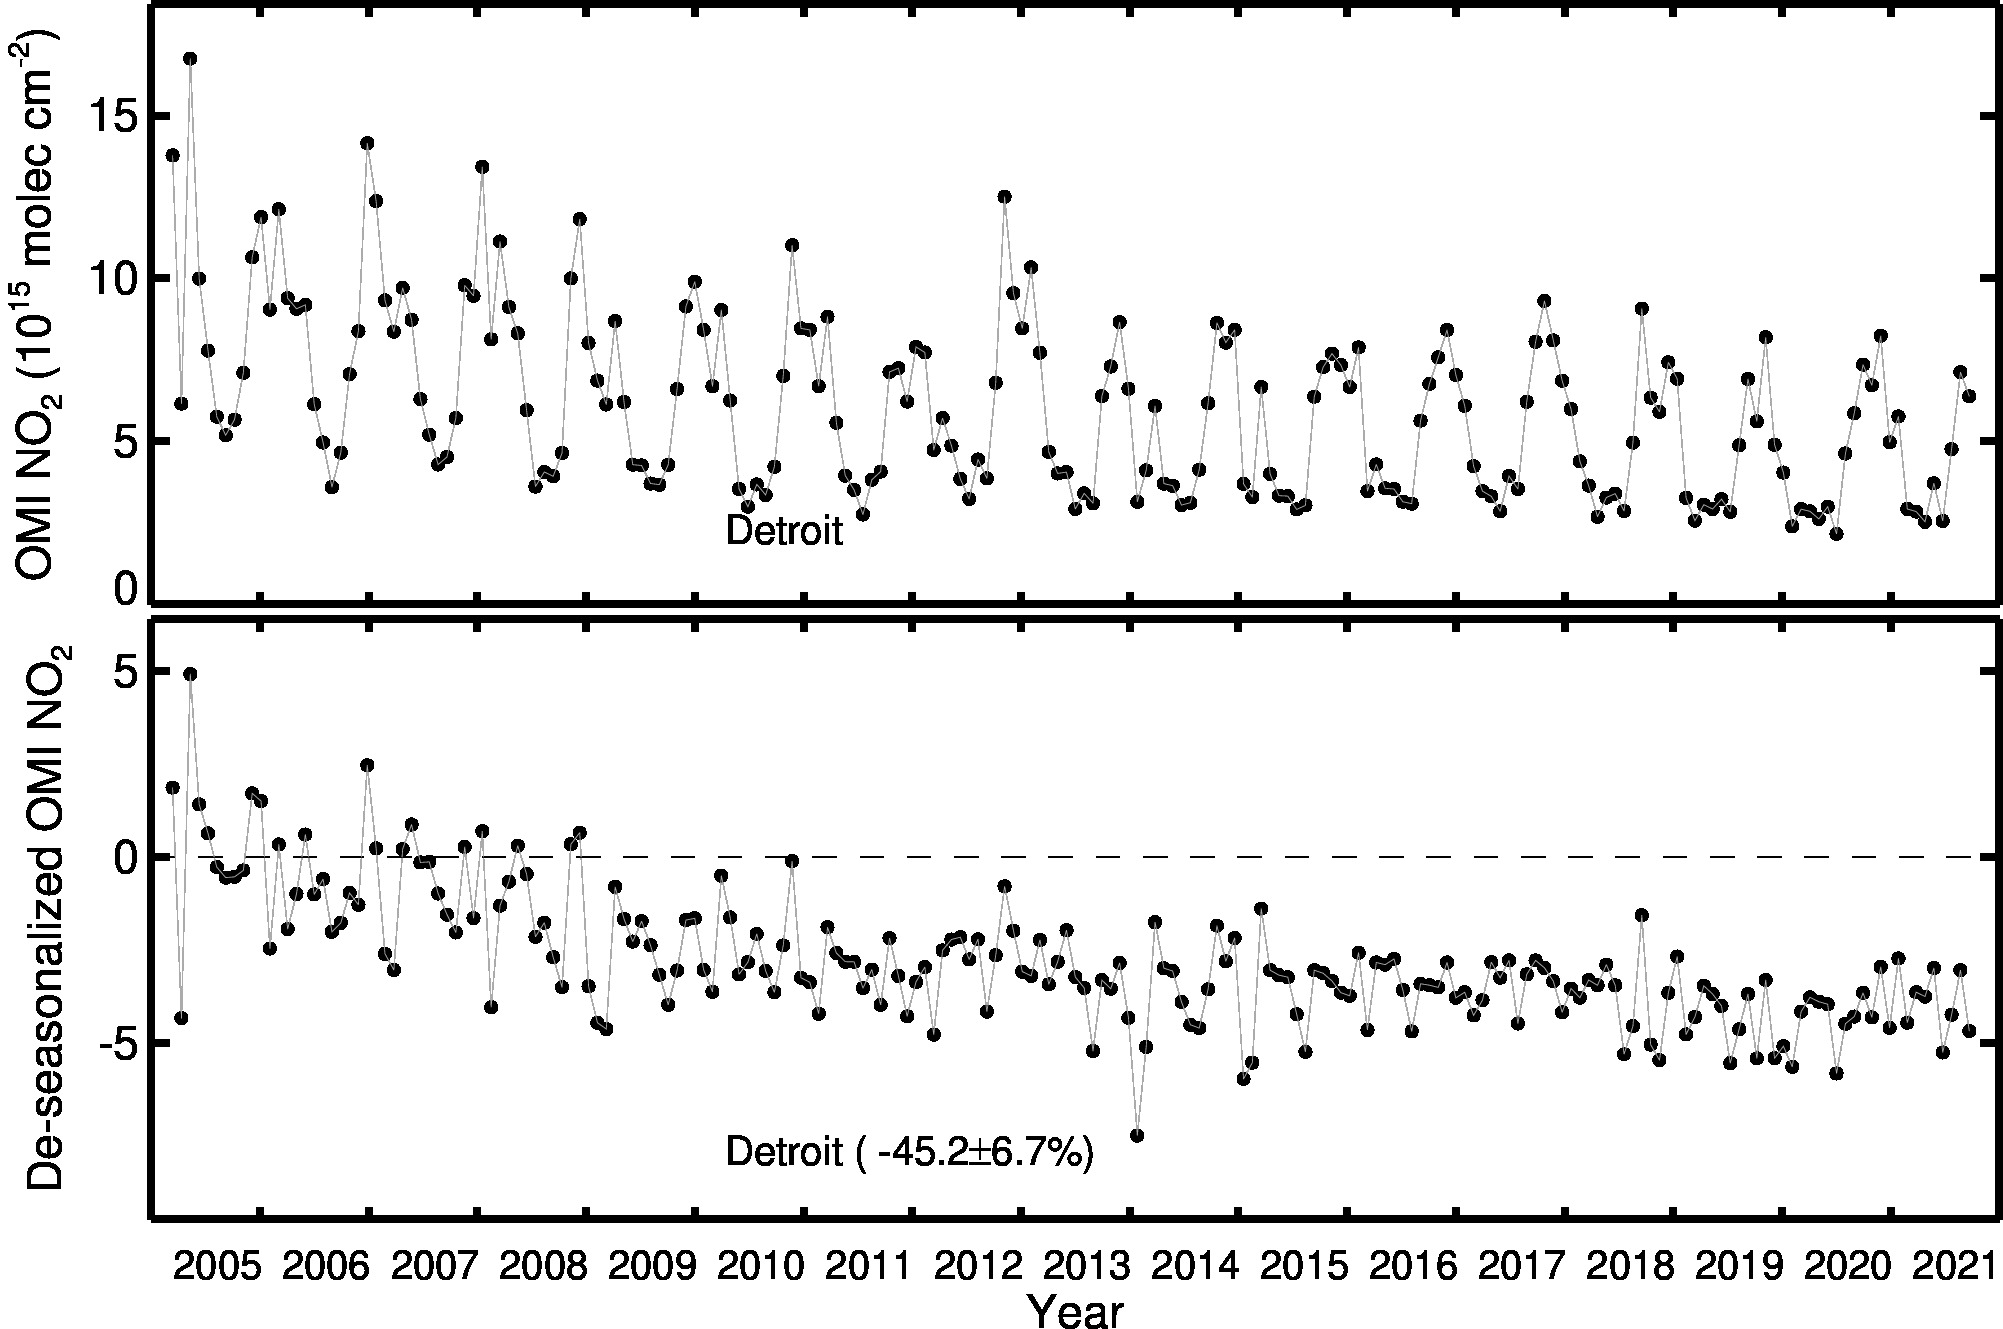
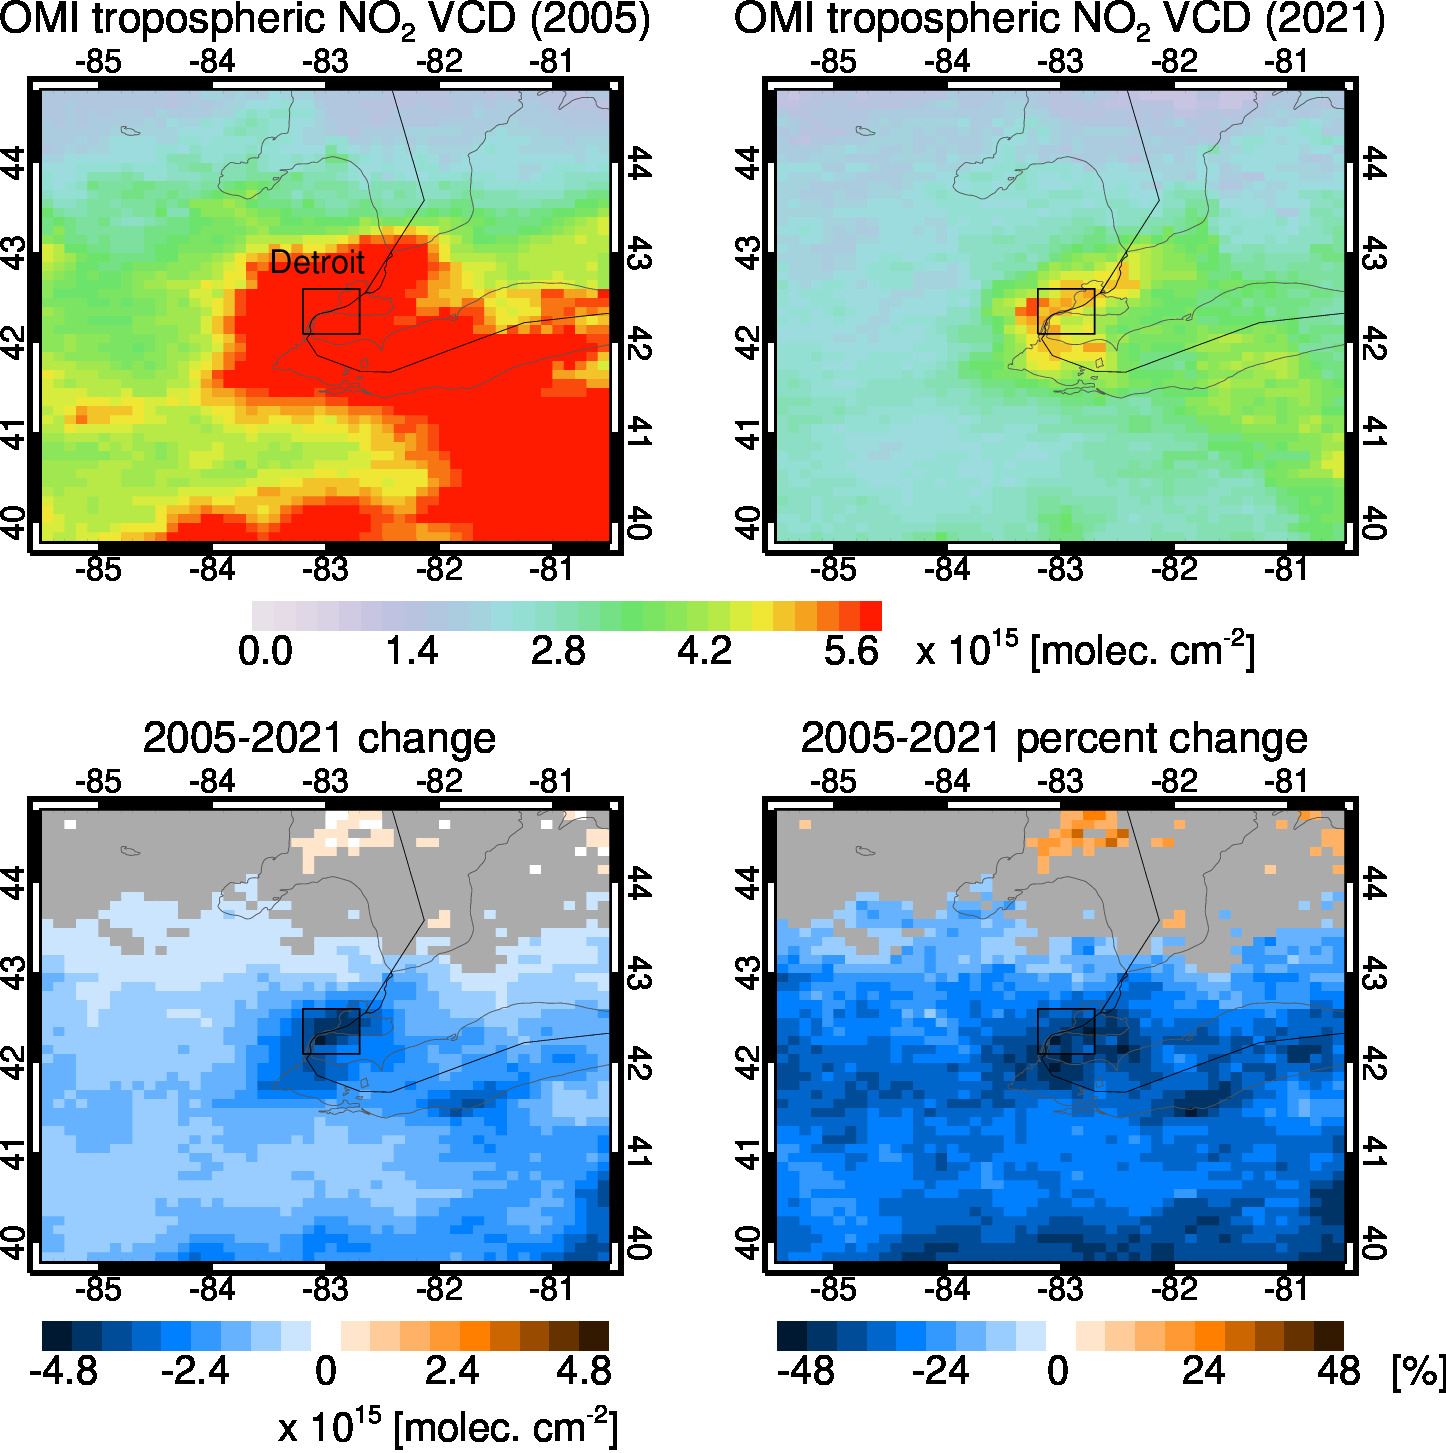
Detroit
Country:
United States
Change since 2005:
-45.2101 %
Year:
2021
Average NO2:
4.875e+15
Uncertainty (±%):
6.79
Image
Detroit Line Plot 2005-2021
Detroit OMI data between 2005-2021.
Image
Detroit City Trend 2005-2021
Detroit OMI data between 2005-2021.
World Regions
Africa
Central Asia
East Asia
Europe
Middle East
North America
Oceania
South and Central America
South Asia
Southeast Asia
See All World Cities
Jump to Top