

Luanda
Country:
Angola
Year:
2021
Average NO2:
9.106e+14
Uncertainty (±%):
26.46
Image
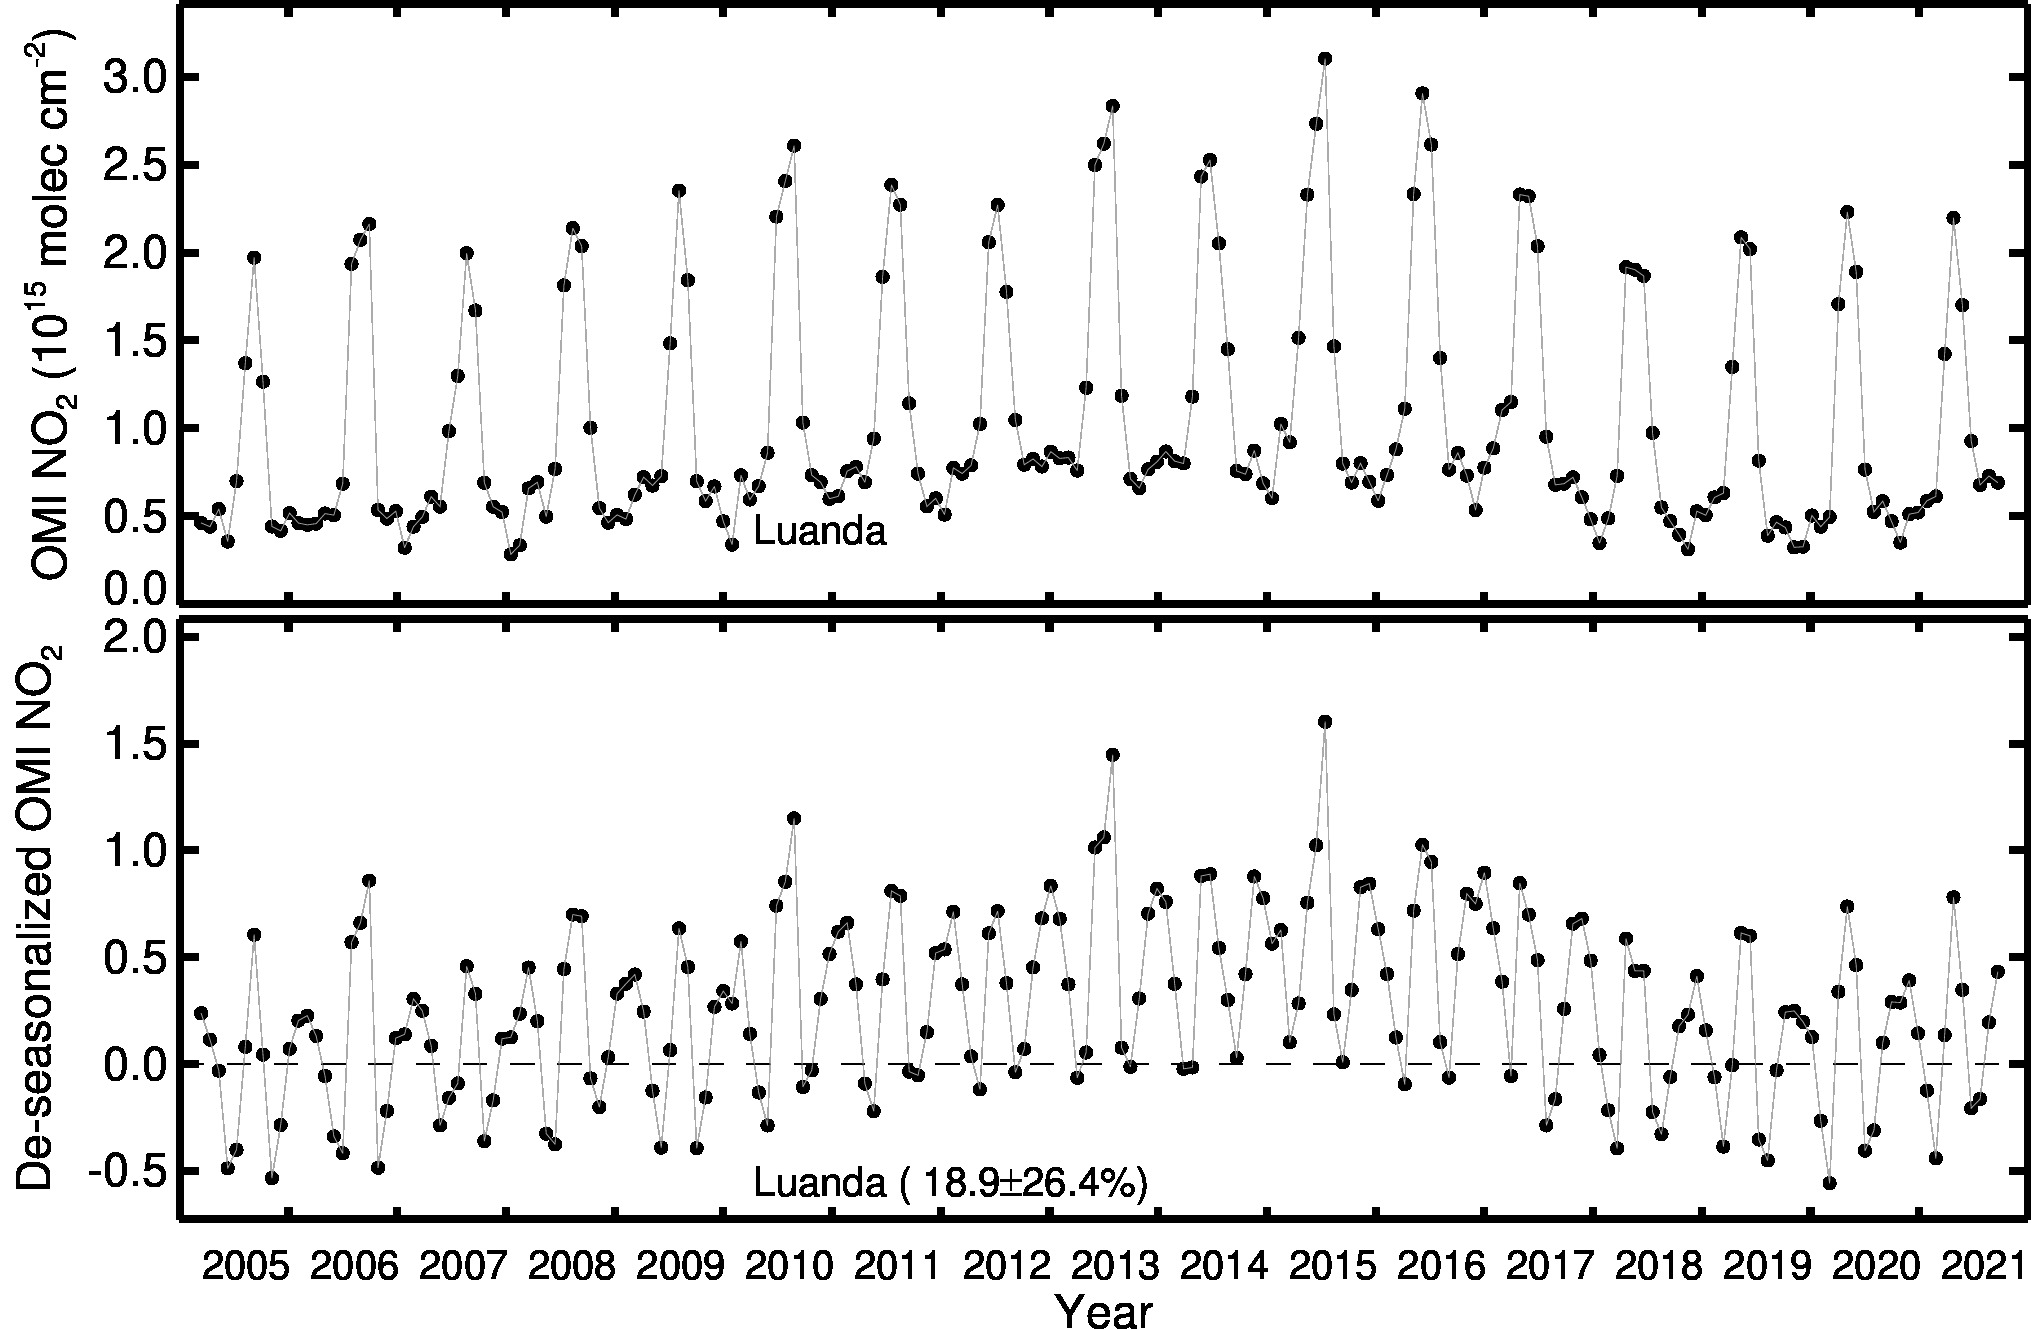
Luanda Line Plot 2005-2021
Luanda OMI data between 2005-2021.
Image
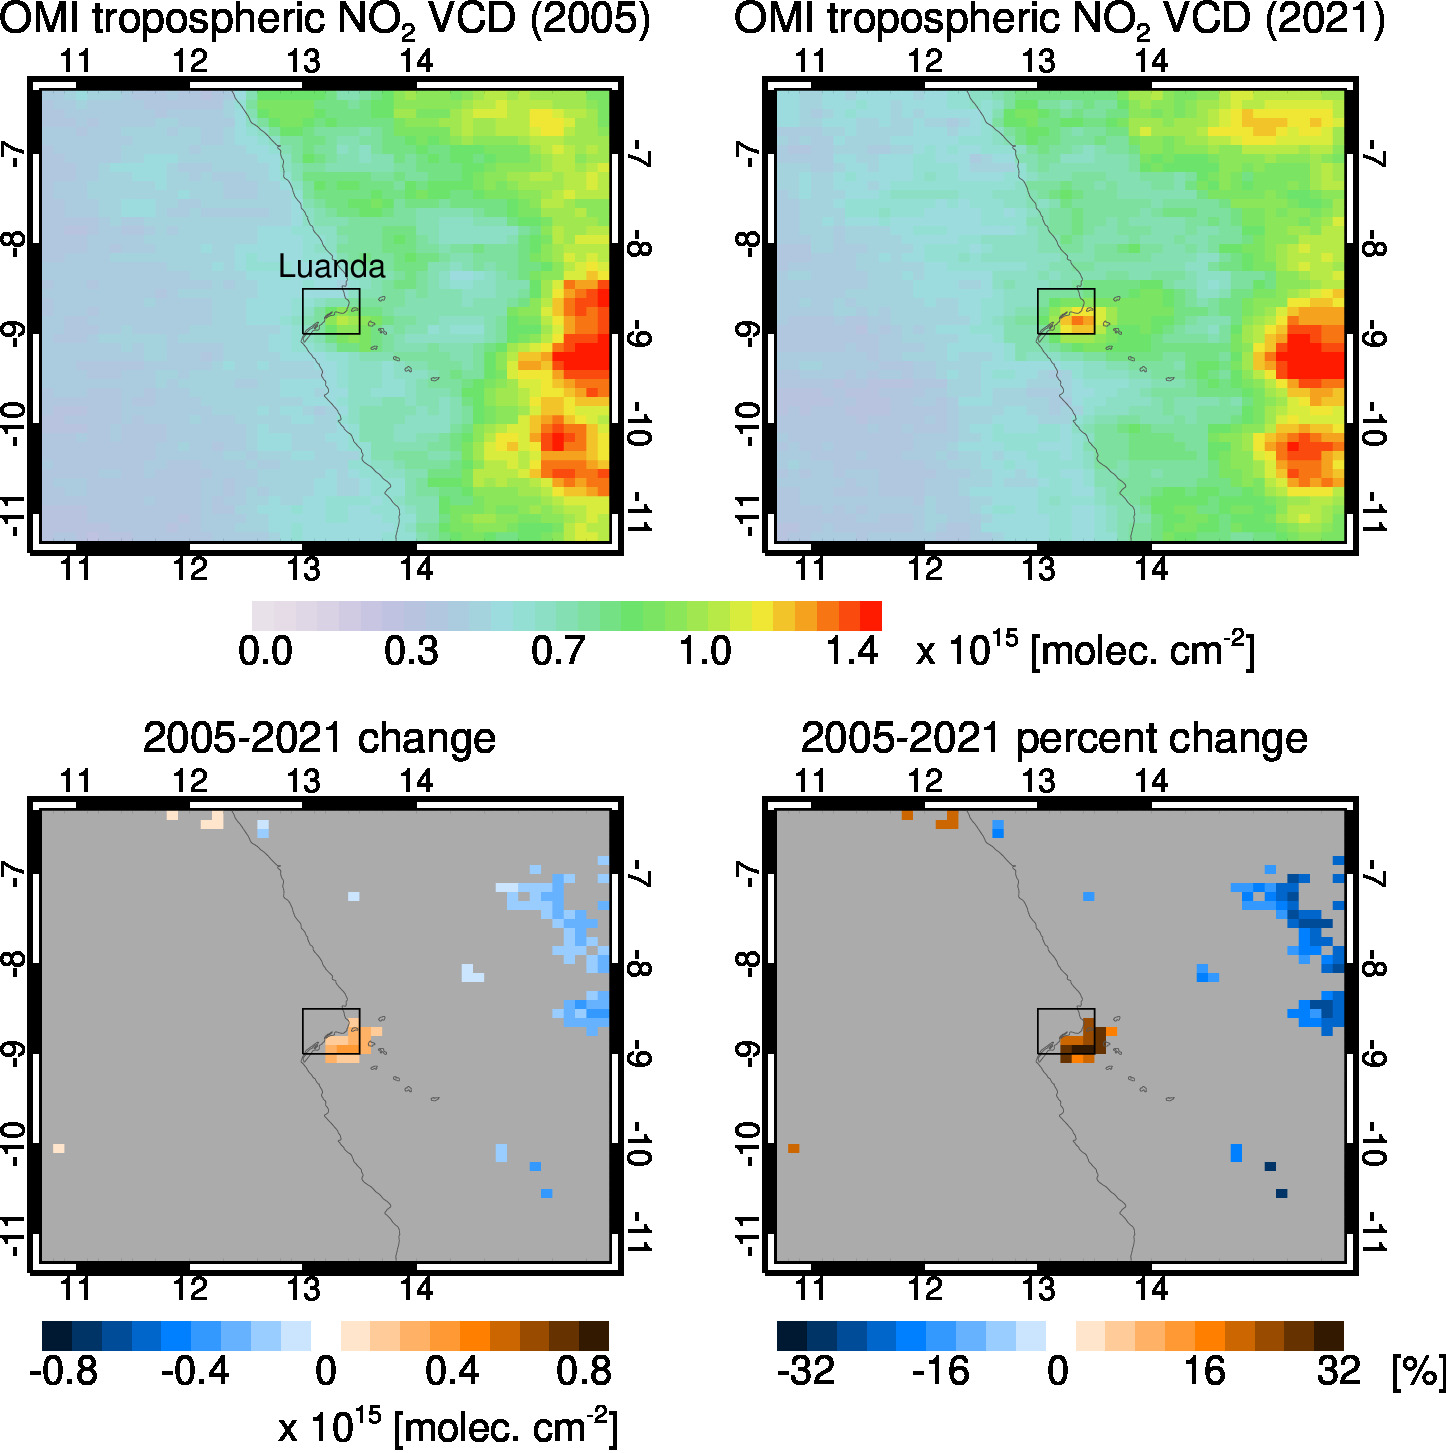
Luanda City Trend 2005-2021
Luanda OMI data between 2005-2021.