

Tampa Florida
Change in NO2:
-53.1
Year:
2016
Average NO2:
3.50
Uncertainty (±%):
7.31
Image
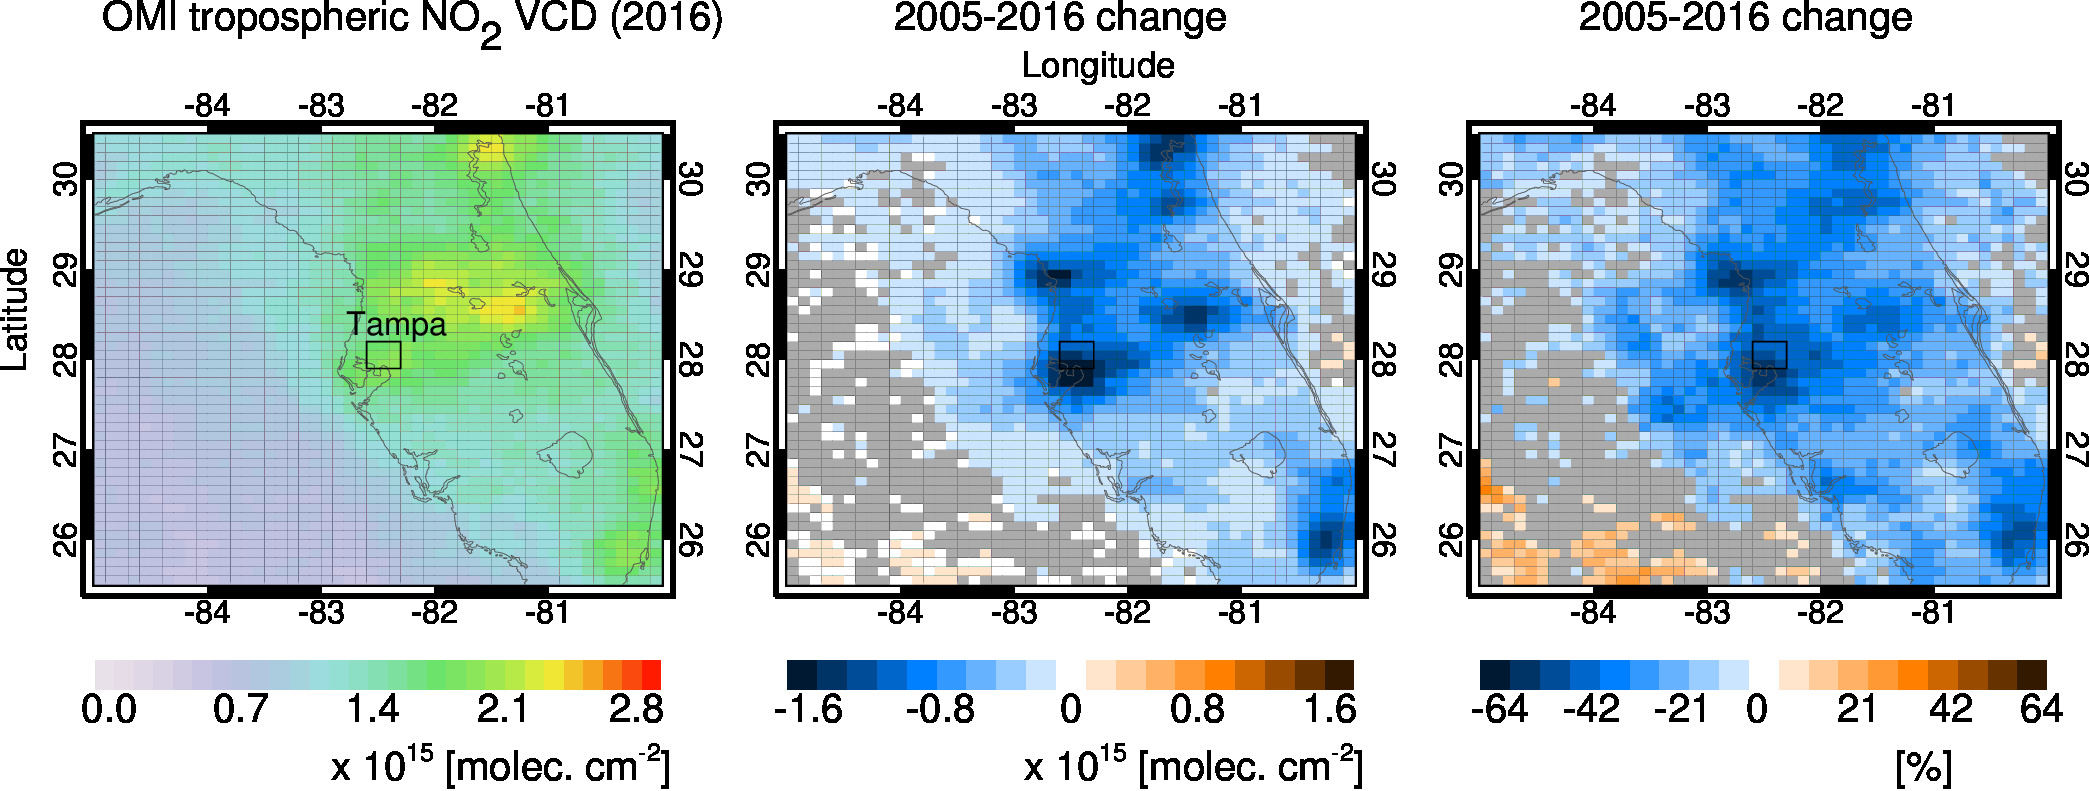
Tampa Florida Trend Map
OMI versus AQS data for Tampa Florida. The filled circles represent trends for EPA AQS surface monitors.
Image
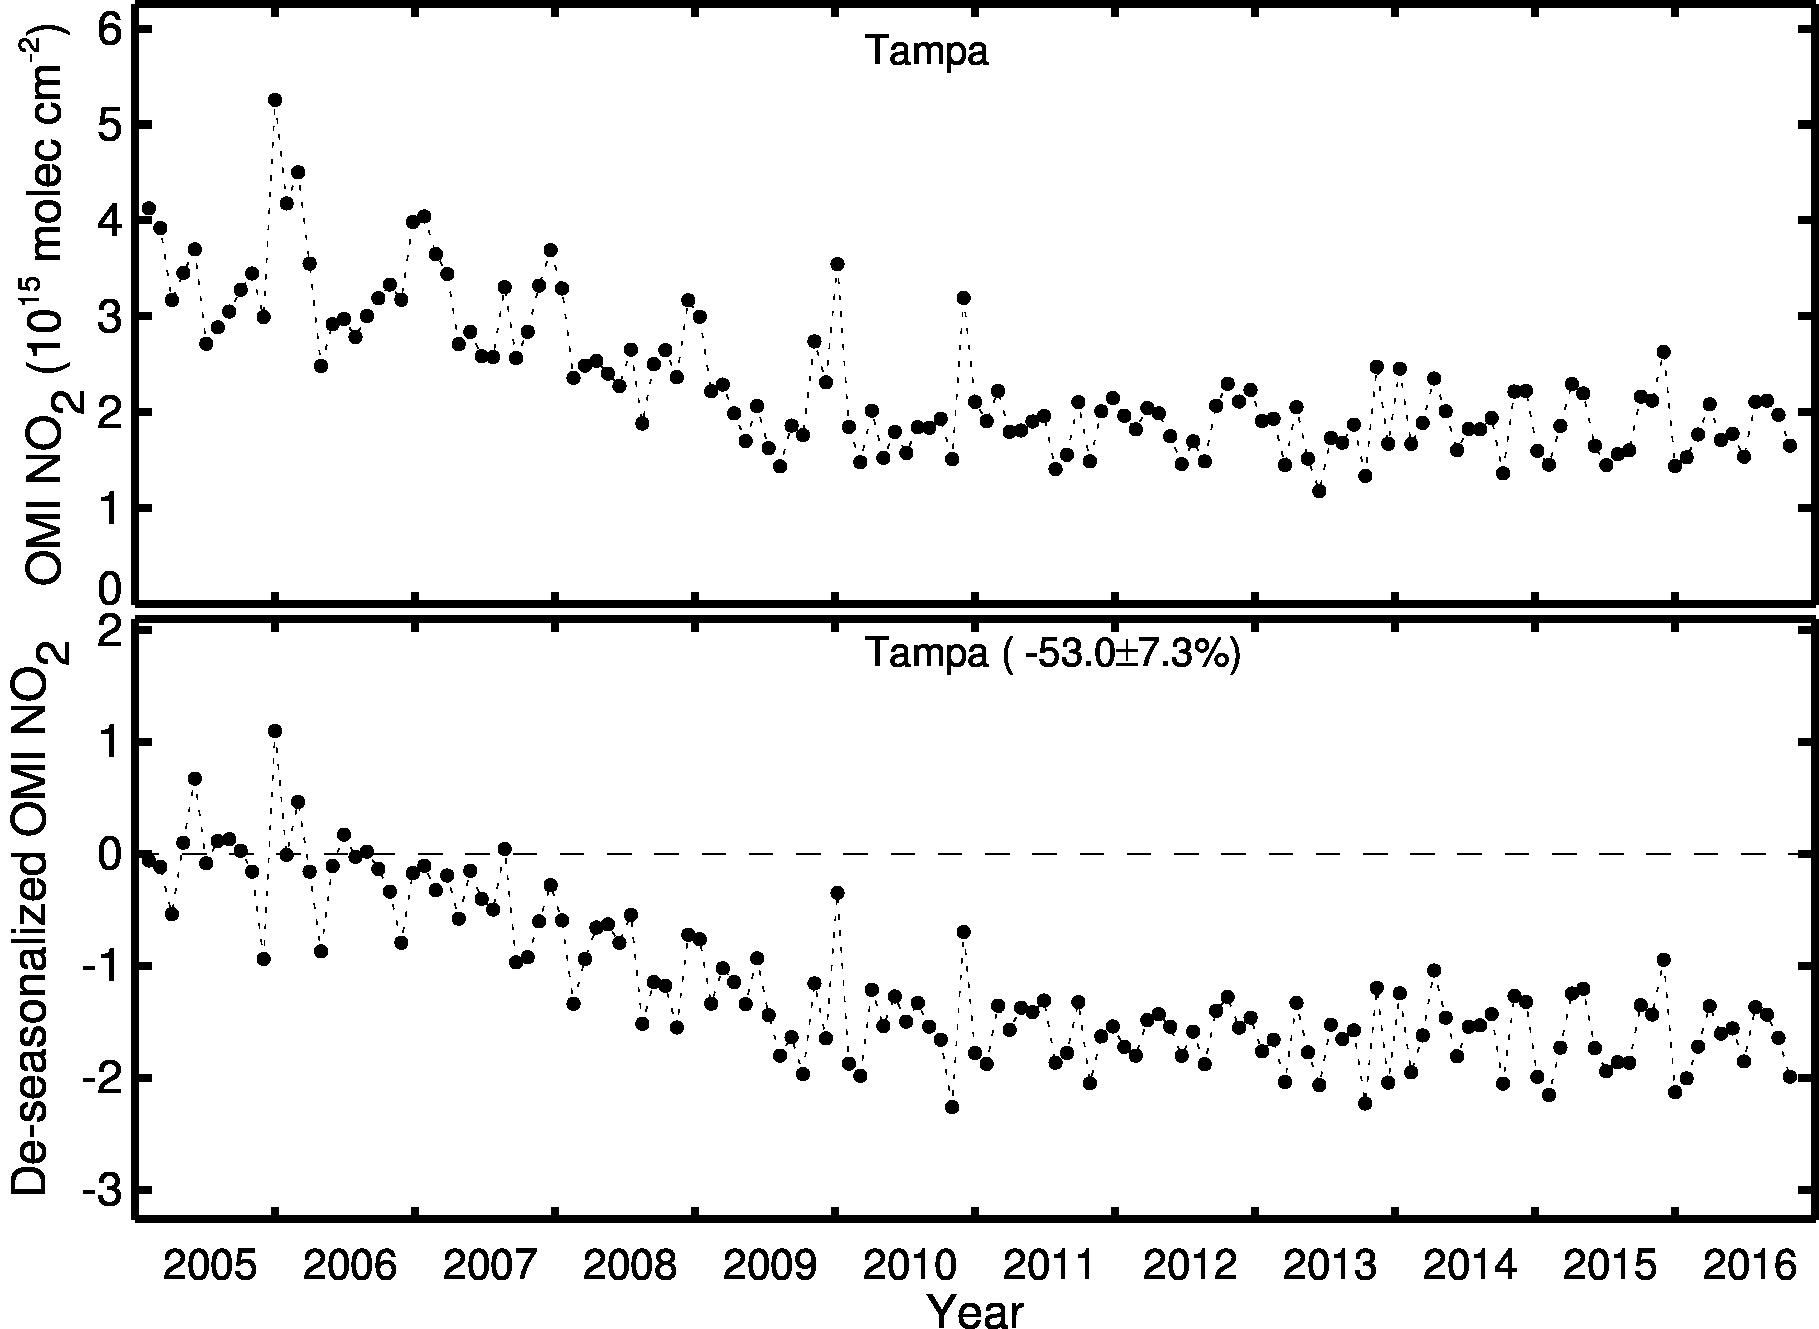
Tampa Florida Line Plot
Monthly OMI Nitrogen Dioxide data (top panel) and de-seasonalized data (bottom panel) for Tampa Florida
Image

Image Credit:
NASA Goddard's Scientific Visualization Studio/T. Schindler.
Tampa Comparison Imagery
These images show how Tampa's concentration of nitrogen dioxide averaged over 2005 (left) compares to the average over 2011 (right). Measurements of nitrogen dioxide from the Ozone Monitoring Instrument on NASA's Aura satellite depict the concentration of the gas throughout a column of air in the troposphere, Earth's lowest atmospheric layer. The images are color-coded: Orange and red areas denote high concentrations and blue and green denote lower concentrations.
Large City Image

Image Credit:
Robert Simmon, based on Landsat data. Visualization Date: August 14, 2004.
Make your own plots! Download either our ASCII file or our Excel file that contain monthly-averaged OMI NO2 data for a number of US metro areas from 2005 to 2016. The file can be easily imported into Microsoft Excel, for instance.
Select from the cities below to find data and plots specific to each location. To sort, simply click on one of the column headings.
| City | State | 2016 Average NO2 (10^15 molec cm^-2) | Uncertainty (%) | Change since 2005 (%) |
|---|---|---|---|---|
| Akron Ohio | Ohio | 5.47 | 9.99 | -37.92 |
| Albuquerque New Mexico | New Mexico | 2.00 | 7.21 | -49.38 |
| Amarillo Texas | Texas | 1.62 | 8.68 | -24.85 |
| Anaheim California | California | 13.45 | 5.93 | -63.61 |
| Anchorage Alaska | Alaska | 1.50 | 12.60 | -57.43 |
| Arlington Texas | Texas | 4.69 | 6.26 | -40.5 |
| Atlanta Georgia | Georgia | 6.45 | 7.20 | -57.71 |
| Augusta Georgia | Georgia | 2.93 | 8.16 | -39.49 |
| Aurora Colorado | Colorado | 5.42 | 7.41 | -43.2 |
| Aurora Illinois | Illinois | 7.04 | 9.75 | -33.83 |
| Austin Texas | Texas | 2.90 | 7.88 | -27.32 |
| Bakersfield California | California | 4.25 | 7.80 | -62.53 |
| Baltimore Maryland | Maryland | 8.57 | 6.74 | -49.14 |
| Baton Rouge Louisiana | Louisiana | 3.63 | 7.94 | -36.1 |
| Birmingham Alabama | Alabama | 4.08 | 7.09 | -53.35 |
| Boise Idaho | Idaho | 1.91 | 11.35 | -40.95 |
| Boston Massachusetts | Massachusetts | 6.29 | 9.54 | -43.19 |
| Brownsville Texas | Texas | 1.18 | 8.78 | -4.67 |
| Buffalo New York | New York | 4.17 | 10.17 | -38.17 |
| Cape Coral Florida | Florida | 1.54 | 8.08 | -31.69 |
| Chandler Arizona | Arizona | 3.51 | 7.15 | -52.62 |
| Charlotte North Carolina | North Carolina | 4.92 | 6.78 | -48.56 |
| Chattanooga Tennessee | Tennessee | 3.97 | 8.03 | -49.68 |
| Chesapeake Virginia | Virginia | 3.57 | 8.20 | -43.71 |
| Chicago Illinois | Illinois | 11.42 | 9.63 | -47.49 |
| Chula Vista California | California | 4.88 | 7.97 | -50.27 |
| Cincinnati Ohio | Ohio | 7.28 | 7.83 | -50.45 |
| Cleveland Ohio | Ohio | 6.70 | 9.59 | -42.81 |
| Colorado Springs Colorado | Colorado | 2.32 | 8.00 | -37.77 |
| Columbus Georgia | Georgia | 2.30 | 8.80 | -32.59 |
| Columbus Ohio | Ohio | 4.90 | 11.72 | -31.84 |
| Corpus Christi Texas | Texas | 1.42 | 11.13 | -8.54 |
| Dallas Texas | Texas | 4.63 | 6.53 | -40.25 |
| Denver Colorado | Colorado | 5.42 | 7.41 | -43.2 |
| Des Moines Iowa | Iowa | 2.20 | 9.50 | -25.86 |
| Detroit Michigan | Michigan | 8.26 | 9.47 | -44.21 |
| Durham North Carolina | North Carolina | 3.83 | 7.38 | -44.29 |
| El Paso Texas | Texas | 2.48 | 6.41 | -33.86 |
| Elk Grove California | California | 4.15 | 7.53 | -54.8 |
| Fayetteville North Carolina | North Carolina | 3.28 | 8.04 | -40.07 |
| Fontana California | California | 12.37 | 5.43 | -63.87 |
| Fort Lauderdale Florida | Florida | 2.88 | 7.16 | -46.7 |
| Fort Wayne Indiana | Indiana | 3.47 | 11.44 | -17.51 |
| Fort Worth Texas | Texas | 4.03 | 6.46 | -40.28 |
| Fremont California | California | 5.26 | 8.70 | -63.43 |
| Fresno California | California | 3.09 | 10.39 | -58.82 |
| Garden Grove California | California | 12.41 | 6.94 | -58.59 |
| Garland Texas | Texas | 4.23 | 7.25 | -35.18 |
| Gilbert Arizona | Arizona | 3.95 | 6.64 | -54.07 |
| Glendale Arizona | Arizona | 6.76 | 7.25 | -62.86 |
| Glendale California | California | 15.15 | 5.40 | -65.69 |
| Grand Prairie Texas | Texas | 4.50 | 6.21 | -40.65 |
| Grand Rapids Michigan | Michigan | 4.33 | 13.65 | -33.04 |
| Greensboro North Carolina | North Carolina | 4.50 | 7.76 | -46.85 |
| Henderson Nevada | Nevada | 4.16 | 7.08 | -58.31 |
| Hialeah Florida | Florida | 3.02 | 6.95 | -40.4 |
| Honolulu Hawaii | Hawaii | 0.94 | 7.05 | -26.7 |
| Houston Texas | Texas | 5.80 | 7.39 | -40.6 |
| Huntington Beach California | California | 8.78 | 8.42 | -52.19 |
| Huntsville Alabama | Alabama | 2.84 | 8.85 | -36.41 |
| Indianapolis Indiana | Indiana | 5.54 | 8.79 | -41.03 |
| Irvine California | California | 8.30 | 7.42 | -61.53 |
| Irving Texas | Texas | 5.15 | 6.62 | -42.28 |
| Jackson Mississippi | Mississippi | 2.10 | 9.75 | -23.89 |
| Jacksonville Florida | Florida | 3.54 | 7.50 | -42.88 |
| Jersey City New Jersey | New Jersey | 15.16 | 7.70 | -47.23 |
| Kansas City Missouri | Missouri | 4.21 | 7.59 | -53.72 |
| Knoxville Tennessee | Tennessee | 4.21 | 8.04 | -49.98 |
| Laredo Texas | Texas | 1.67 | 8.40 | -20.92 |
| Las Vegas Nevada | Nevada | 4.24 | 6.98 | -57.67 |
| Lexington Kentucky | Kentucky | 3.79 | 9.44 | -37.44 |
| Lincoln Nebraska | Nebraska | 1.85 | 10.62 | -15 |
| Little Rock Arkansas | Arkansas | 2.57 | 8.66 | -34.03 |
| Long Beach California | California | 15.81 | 6.71 | -58.01 |
| Los Angeles California | California | 13.32 | 6.01 | -62.44 |
| Louisville Kentucky | Kentucky | 5.53 | 9.28 | -44.91 |
| Lubbock Texas | Texas | 1.50 | 8.83 | -17.96 |
| Madison Wisconsin | Wisconsin | 2.69 | 10.42 | -19.25 |
| McKinney Texas | Texas | 3.15 | 9.06 | -34.86 |
| Memphis Tennessee | Tennessee | 3.41 | 8.28 | -43.01 |
| Mesa Arizona | Arizona | 4.45 | 6.59 | -56.11 |
| Miami Florida | Florida | 3.02 | 8.08 | -36.7 |
| Milwaukee Wisconsin | Wisconsin | 6.48 | 10.05 | -46.31 |
| Minneapolis Minnesota | Minnesota | 5.25 | 10.74 | -39.41 |
| Mobile Alabama | Alabama | 2.87 | 8.09 | -29.88 |
| Modesto California | California | 3.98 | 8.23 | -58.1 |
| Montgomery Alabama | Alabama | 2.59 | 7.97 | -37.03 |
| Moreno Valley California | California | 9.75 | 6.12 | -64.18 |
| Nashville Tennessee | Tennessee | 4.49 | 9.45 | -45.51 |
| New Orleans Louisiana | Louisiana | 2.97 | 8.19 | -26.54 |
| New York New York | New York | 15.95 | 7.24 | -46.9 |
| Newark New Jersey | New Jersey | 13.75 | 8.21 | -45.07 |
| Newport News Virginia | Virginia | 3.86 | 8.43 | -46.41 |
| Norfolk Virginia | Virginia | 4.10 | 8.01 | -50.25 |
| North Las Vegas Nevada | Nevada | 4.00 | 6.93 | -59 |
| Oakland California | California | 5.32 | 8.15 | -54.3 |
| Oceanside California | California | 3.33 | 10.99 | -53.91 |
| Oklahoma City Oklahoma | Oklahoma | 2.82 | 7.62 | -35.63 |
| Omaha Nebraska | Nebraska | 2.58 | 10.19 | -27.96 |
| Ontario California | California | 15.09 | 5.38 | -66.51 |
| Orlando Florida | Florida | 3.57 | 5.91 | -37.17 |
| Overland Park Kansas | Kansas | 3.52 | 8.18 | -47.23 |
| Oxnard California | California | 2.86 | 10.28 | -49.47 |
| Pembroke Pines Florida | Florida | 2.86 | 6.43 | -45.42 |
| Philadelphia Pennsylvania | Pennsylvania | 9.09 | 7.98 | -47.59 |
| Phoenix Arizona | Arizona | 6.79 | 7.00 | -64.26 |
| Pittsburgh Pennsylvania | Pennsylvania | 9.26 | 10.39 | -50.73 |
| Plano Texas | Texas | 4.28 | 7.55 | -36.59 |
| Port St. Lucie Florida | Florida | 1.82 | 7.62 | -21.41 |
| Portland Oregon | Oregon | 3.97 | 9.09 | -53.9 |
| Providence Rhode Island | Rhode Island | 4.95 | 9.66 | -36.64 |
| Raleigh North Carolina | North Carolina | 3.95 | 7.52 | -44.46 |
| Rancho Cucamonga California | California | 12.78 | 5.37 | -65.25 |
| Reno Nevada | Nevada | 1.97 | 9.50 | -51.96 |
| Richmond Virginia | Virginia | 4.87 | 7.87 | -46.56 |
| Riverside California | California | 11.42 | 5.95 | -64.84 |
| Rochester New York | New York | 3.51 | 11.21 | -33.99 |
| Sacramento California | California | 4.34 | 7.07 | -54.89 |
| Saint Paul Minnesota | Minnesota | 5.30 | 10.60 | -38.2 |
| Salt Lake City Utah | Utah | 6.11 | 18.38 | -57.39 |
| San Antonio Texas | Texas | 3.14 | 6.94 | -30.71 |
| San Bernardino California | California | 9.49 | 5.54 | -58.45 |
| San Diego California | California | 4.08 | 9.07 | -54.16 |
| San Francisco California | California | 4.33 | 10.15 | -46.94 |
| San Jose California | California | 4.19 | 9.42 | -61.65 |
| Santa Ana California | California | 11.84 | 6.71 | -61 |
| Santa Clarita California | California | 4.95 | 6.54 | -64.02 |
| Santa Rosa California | California | 1.53 | 11.09 | -28.41 |
| Scottsdale Arizona | Arizona | 4.92 | 7.14 | -61.05 |
| Seattle Washington | Washington | 5.54 | 8.36 | -51.87 |
| Shreveport Louisiana | Louisiana | 2.52 | 8.36 | -34.35 |
| Sioux Falls South Dakota | South Dakota | 1.34 | 11.47 | 5.15 |
| Spokane Washington | Washington | 1.80 | 8.13 | -28.54 |
| St. Louis Missouri | Missouri | 5.25 | 7.73 | -42.72 |
| St. Petersburg Florida | Florida | 2.86 | 8.24 | -48.35 |
| Stockton California | California | 4.28 | 7.50 | -61.29 |
| Tacoma Washington | Washington | 5.47 | 9.85 | -44.85 |
| Tallahassee Florida | Florida | 1.63 | 8.77 | -22.62 |
| Tampa Florida | Florida | 3.50 | 7.31 | -53.1 |
| Tempe Arizona | Arizona | 4.84 | 6.59 | -59.28 |
| Toledo Ohio | Ohio | 6.05 | 8.44 | -40.27 |
| Tucson Arizona | Arizona | 2.25 | 6.50 | -52.29 |
| Tulsa Oklahoma | Oklahoma | 2.94 | 7.44 | -37.62 |
| Vancouver Washington | Washington | 3.74 | 8.93 | -52.73 |
| Virginia Beach Virginia | Virginia | 3.80 | 9.31 | -46.36 |
| Washington D.C. | District of Columbia | 8.65 | 6.80 | -50.72 |
| Wichita Kansas | Kansas | 1.93 | 8.99 | -20.37 |
| Winston Salem North Carolina | North Carolina | 4.10 | 7.81 | -44.27 |
| Worcester Massachusetts | Massachusetts | 4.07 | 12.04 | -29.67 |
| Yonkers New York | New York | 11.33 | 9.04 | -50.33 |